
Introducing today, our new Language Models-derived inflation metrics: the "News Balance". Beyond conventional time series, they provide access to a virtually unlimited reservoir of time series extracted through advanced text analysis. Welcome to a new era of text-based insights into economic analysis.
Filling the Gap Between Micro And Macro
Our text data delves into inflation intricacies, identifying things like airfares changes, delivery costs, drug prices, hairdresser tariffs, etc. Assembled in the NewsBot, this information becomes a critical input for short-term inflation forecasting.
At the aggregated level, the News Inflationary Pressures Indices (NIPI) shows the balance of positive and negative news volumes (Headline, Core, Food...).1
Yet, a significant gap exists between the two levels. For instance, if we wanted to monitor airfare news in country X over the past twelve months, there is no pre-defined NIPI time series for that and scanning through all related news stories could be a serious endeavour.
News Balance
To narrow the gap between micro-level narratives and the macro inflation picture has been a long-standing customer request.
We recently found a way for users to craft their personalized time series of inflation pressures for virtually any item, such as airfares, leveraging on our proven Language Models.
How does it work? Users formulate a text query to search for inflation news in our online app (or "prompt", as they say). In return, they get the balance of positive and negative news for that specific query.
Thanksgiving
Let us consider the instance of U.S. inflation-related news mentioning "Thanksgiving" over a twelve-month period. The search focusses on "Thanksgiving" in the news title or summary, narrowing down the results to the US location and the Food price sector:
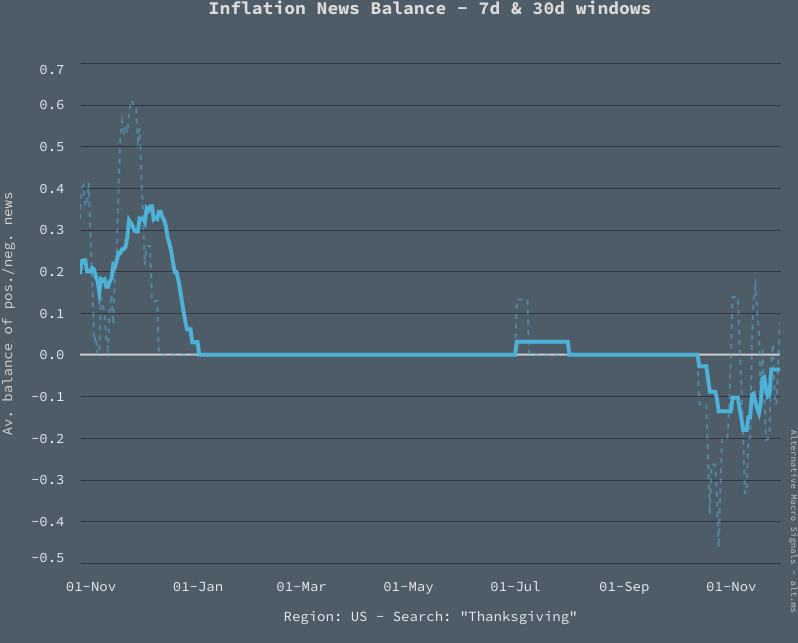
The chart depicts the seven-day and thirty-day moving averages for the News Balance associated with this query, in the last 13 months.
The News Balance represents the ratio of positive and negative news2. A score of 0 signifies neutrality, 1 suggests a strongly positive inflation signal and -1 a strongly negative one.
Interpretating this chart is straightforward. There is an obvious seasonality aspect to the request: for most of the year, there simply is no Thanksgiving news. Around the 2023 Thanksgiving time, the news flow has been negative, contrasting with the situation in 2022.
Let's get back to our airfare exemple above. Here are the News Balances for airfares in the US, in the last 13 months:
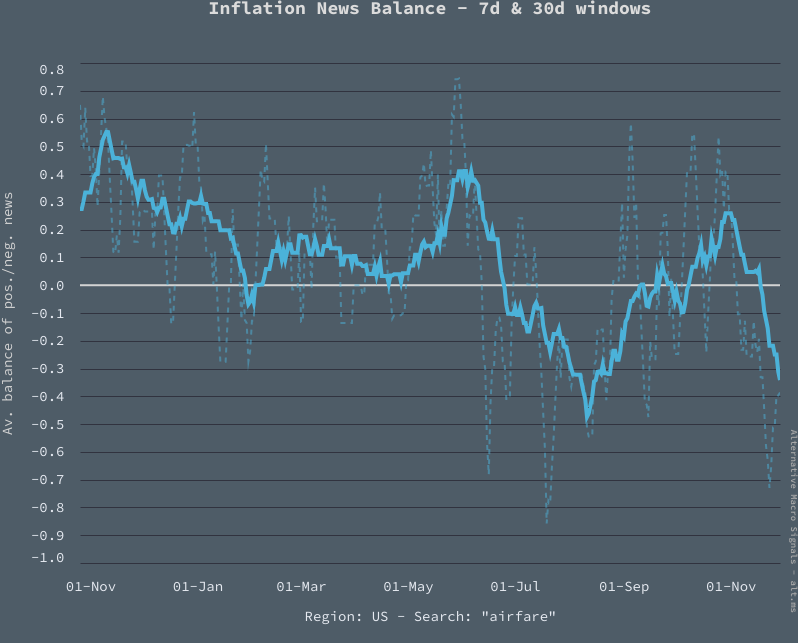
You can guess the volume of news throughout the year is larger here. There is a simple pattern, too: airfare news have been predominently negatively oriented in the last six months or so.
Here is another use case: international car price compareason.
Language Models emerge as transformative tools across various activities, including research. While their potential is substantial, extracting the utmost value requires time and field expertise. The News Balance, at our level, represents a milestone. It is not merely a novel model, or yet another dataset; rather, it illustrates an entirely new approach to leveraging on Language Models and executing tasks that were once deemed implausible.
1. More details on the NewsBot can be found on their respective presentation pages here and here.
2. The News Balance (NB) is based on the difference between positive and negative news divided by the total number of news, on a given day. More precisely: the sum of the probabilities of news being positive for news which have an above 0.60 probability of being positive minus the similar metric for negative news divided by total news. The NB is therefore bound by -1 and 1, but both being extreme values implying all the news in the sample have a probability of 1 of being positive or negative.
