The AMS API provides access to NIPI data for 23 economies and 7 sector breakdowns, as well as the News Volume Index and the underlying Entropy components. It can be integrated into any Python workflow to monitor inflation pressures in real time, build cross-country dashboards, or feed forecasting models. To illustrate how the /nipi endpoint can be used in practice, we are releasing two new use-case pages.
NIPI use cases
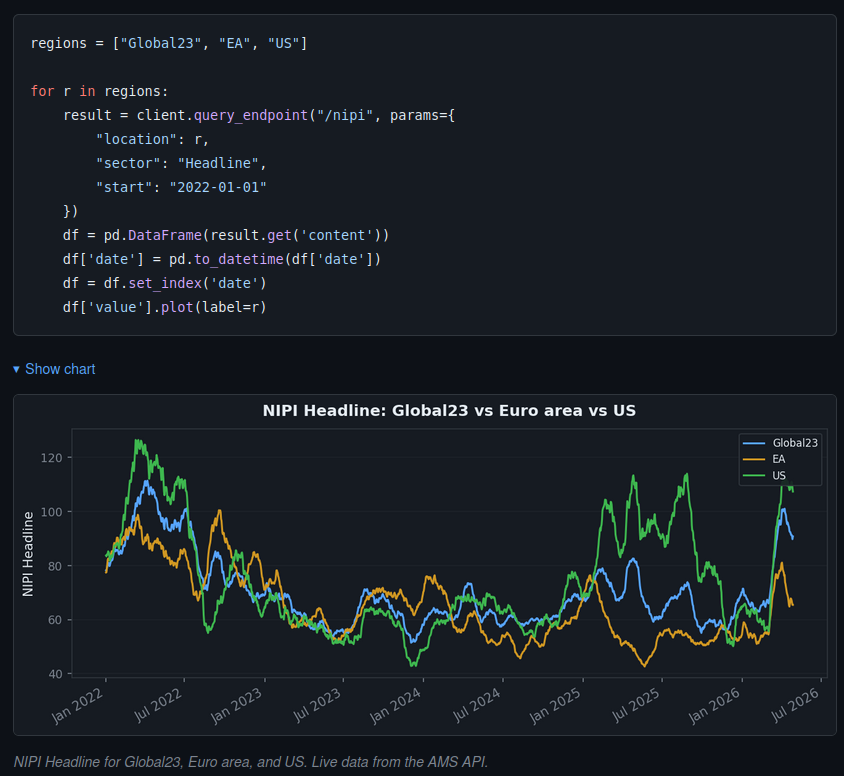
The NIPI use-case page shows how to retrieve NIPI data through the ams-sdk Python package and put it to use. Starting from a simple single-country query, the examples progressively cover cross-country rankings, regional aggregates (Global23, Euro area), and sector-level breakdowns. A final section introduces the News Volume Index (NVI), an additional metric available through the same endpoint that tracks the daily volume of inflation-related news. These are starting points that can be adapted and extended to fit specific workflows. The chart below illustrates a typical output you can build with a few lines of code. For more examples and ready-to-use notebooks, see this page.
Illustration 1: Using the NIPI API, Regional aggregates
Entropy use cases
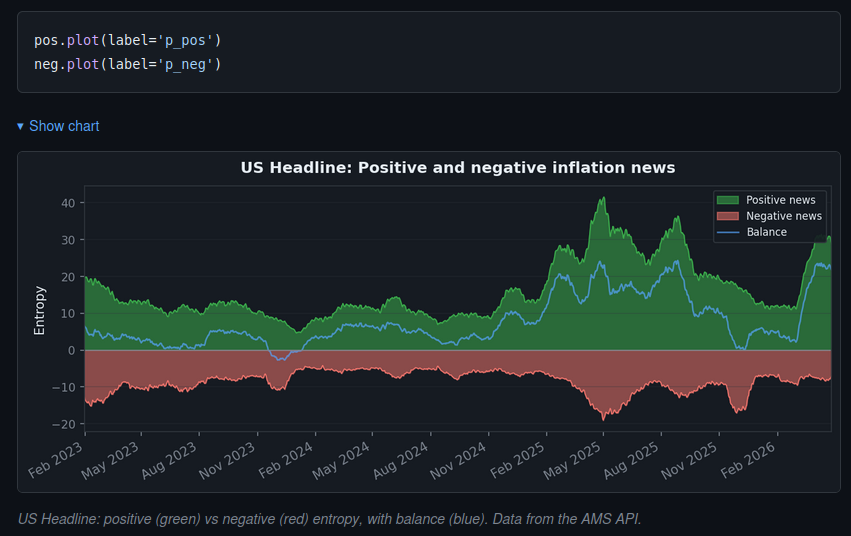
The Entropy use-case page focuses on the daily components from which the NIPI is constructed. The NIPI is derived from the balance between positive and negative inflation news signals, averaged over a 30-day window. The Entropy metric gives direct access to these signals before aggregation. Each component reflects a different facet of the news signal: p_pos captures the intensity of upward price pressure in the news, p_neg captures downward pressure, and p_neu the neutral flow. Unlike the NIPI, these values are daily and unsmoothed, offering a more granular view of how the signal evolves before the 30-day averaging step. The examples show how to extract and visualize these components, compare them across countries and sectors, and combine them with external data such as official CPI releases. As with the NIPI page, these examples serve as starting points and can be extended to suit more specific analyses. Here is a sample visualization built from the entropy components. More examples are available here.
Illustration 2: Using Entropy API, Inflation pressure balance
Both pages are designed as self-contained references: each includes setup instructions, code snippets, and charts built from live data. They are available in the API documentation alongside the existing nbstat use cases. For a complete overview of the API, including authentication, endpoints, and rate limits, see the API documentation README.
To know more about our data,reach out.
