Inflation narratives move fast, and most of them never make it into the official data until months later. Our new Themes heatmaps track them daily across ten economies — here's what they're showing right now in China and the US.
Every day, thousands of news items potentially impact the near-term inflation outlook. The hard part is spotting which stories are gaining ground and which are fading — across many countries at once. Themes, a new feature in the AMS client portal, does exactly that: it shows, at a glance, the drivers behind inflation pressures in the news and how they have evolved, making it much easier to catch what’s new in today’s inflation news flow.
For each news item relevant to the near-term inflation outlook (the ones we care about), our models identify the specific good or service for which price changes are observed. Drawing on our language models — live and truly out-of-sample since 2020 — we also identify whether each theme’s contribution to inflation is positive or negative.
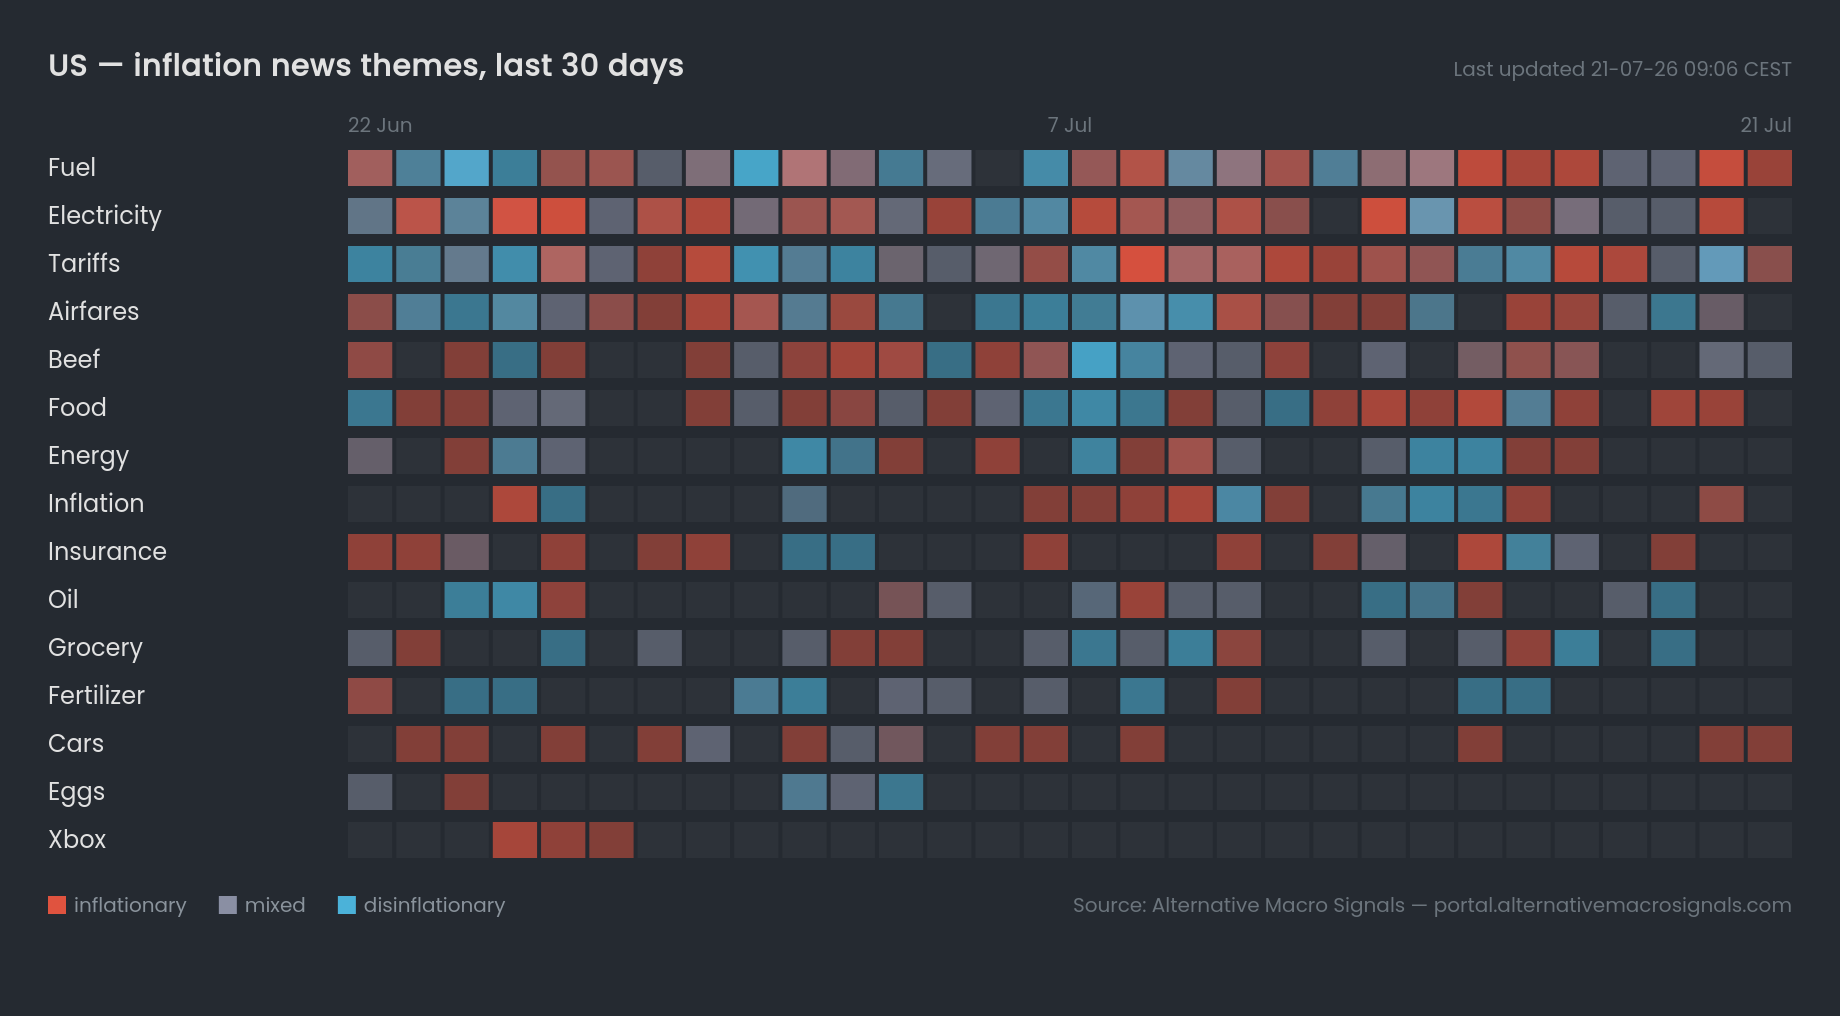
This information is summarized in daily heatmaps, which give a direct, at-a-glance view of which themes are generating the most coverage and where that coverage is pointing. Each row is a topic. Each column is a day. The color of each cell reflects the balance of signal probabilities from that day's news: red when the positive (inflationary) probability dominates, blue when the negative (disinflationary) probability dominates, grey when the signal is mixed. Reading across the heatmap from left to right shows how each theme has evolved over the past month, whether a topic has shifted direction, held steady, or faded from coverage altogether. A quick way to read it: a row turning from blue to red is a narrative flipping; a row fading to empty is a story the news has stopped telling.
This blog post walks through recent data in a few countries, highlighting how it can be used to understand and quantify ongoing narratives.
China: a mix of global and local factors
China's heatmap speaks to its unique place at the center of global economic chains. Electronics carries one of the strongest and most sustained inflationary signals across all ten economies, holding across the full period. The pressure runs from components to finished devices. A CCTV Finance report from Shenzhen's Huaqiangbei market, China's largest electronics hub, described consumer storage prices surging over the past year, with a 32GB DDR5 memory kit rising from around 900 to 3,800 yuan. As a sector study explains, prices for smartphones and computers have continued to rise: Apple CEO Tim Cook acknowledged that these increases were inevitable, while brands such as OnePlus have raised the prices of their flagship models, as demand for memory chips related to artificial intelligence has reduced the supply available for consumer electronics.
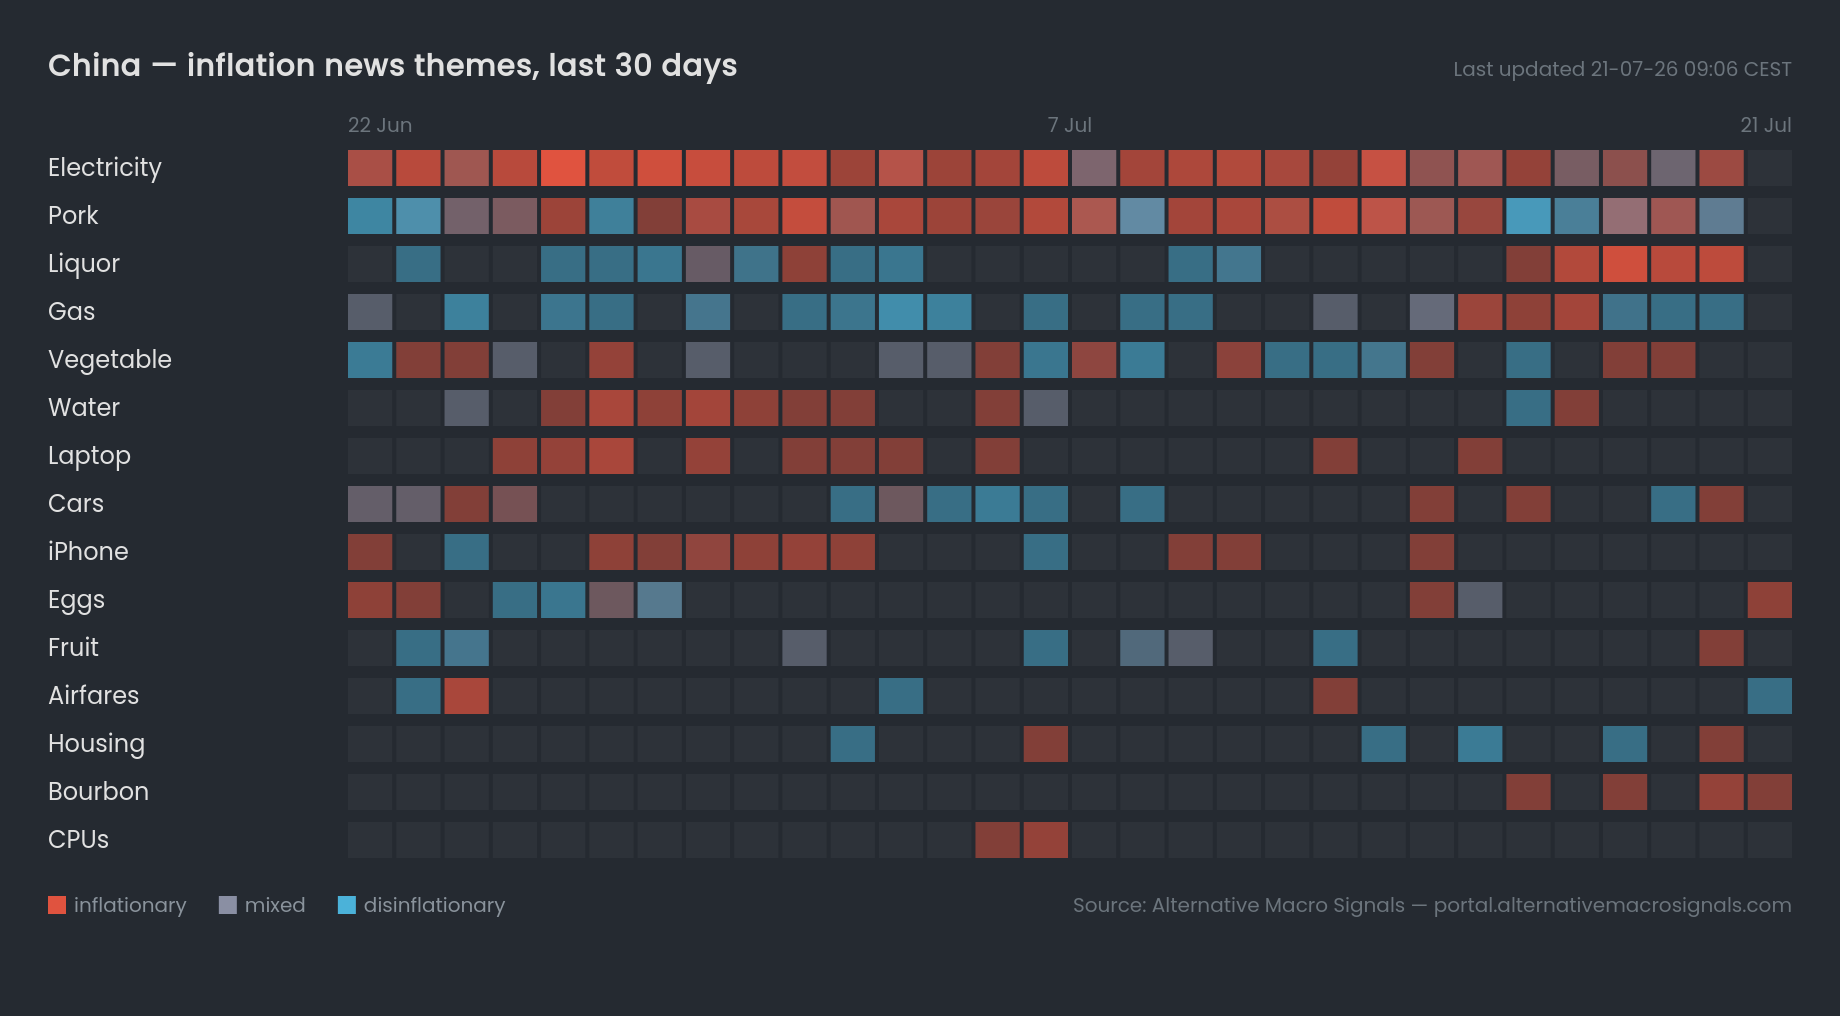
Pork is another key theme, active throughout the period. It is traditionally a key domestic driver of Chinese inflation — and one that’s hard to track without access to local sources. Its signal has just flipped inflationary — a sharp reversal within the food category after weeks of disinflationary readings. According to New Weekly citing the Chinese Ministry of Agriculture, wholesale pork prices rebounded in early July after several weeks of decline, with prices for live hogs rising by approximately 9.5 to 11.4 yuan per kilogram between late June and early July due to tighter supply. Analysts point out, however, that this is more of a gradual rebound than a reversal of the overall pork cycle, as supply remains abundant.
United States: broad-based pressures
The U.S. heatmap shows inflation action across a wide range of themes. What stands out is not only the intensity of the signal, but also its broad scope: food, meat, airfares, and electronics are among the most actively covered themes throughout the period, spanning goods, services, and essential items alike.
Tariffs show a mixed but inflation-leaning signal over the period. Recent coverage suggests the pressure has further to run. A recent New York Fed survey shows that half of the firms which paid tariffs in 2025 were still planning to raise prices, with the pass-through expected to stretch past 2026.
The Themes heatmaps offer a fast, structured way to read inflation pressures through the news.
In a single view, they show which topics are driving coverage across ten economies, in which direction, and how that has shifted over the past month.
The cases above are only a sample. The same approach extends to any of the ten economies and any of the themes tracked, whether the question is a single country, a single topic, or a comparison across borders. Combined with the nbstat and Entropy data, the analysis can be taken further still. Bottom line? Themes turns a month of global inflation coverage into a picture you can read in ten seconds.
To know more about our data,reach out.
