The Global23 NIPI aggregate uniquely tracks news-based inflation pressures at the global level. We show how it can be read next to standard CPI aggregates and how it can also feed simple forecasting exercises for global inflation. You can subscribe to the Global23 NIPI monthly updates here.
The recent global inflation cycle has shown how quickly pressures can build and dissipate across economies. Monitoring these movements in real time remains a challenge, since official price data are released with a lag and at different frequencies. The NIPI, our daily index that tracks the balance of between positive and negative inflation news over a rolling 30-day window, offers a timely signal.
Building on this, the Global23 aggregates NIPI values from 23 economies into a single global indicator, which can then be read alongside official CPI data or used as an input in forecasting exercises. For a full description of how the aggregate is constructed, see Global23 NIPI Aggregate Methodological Note.
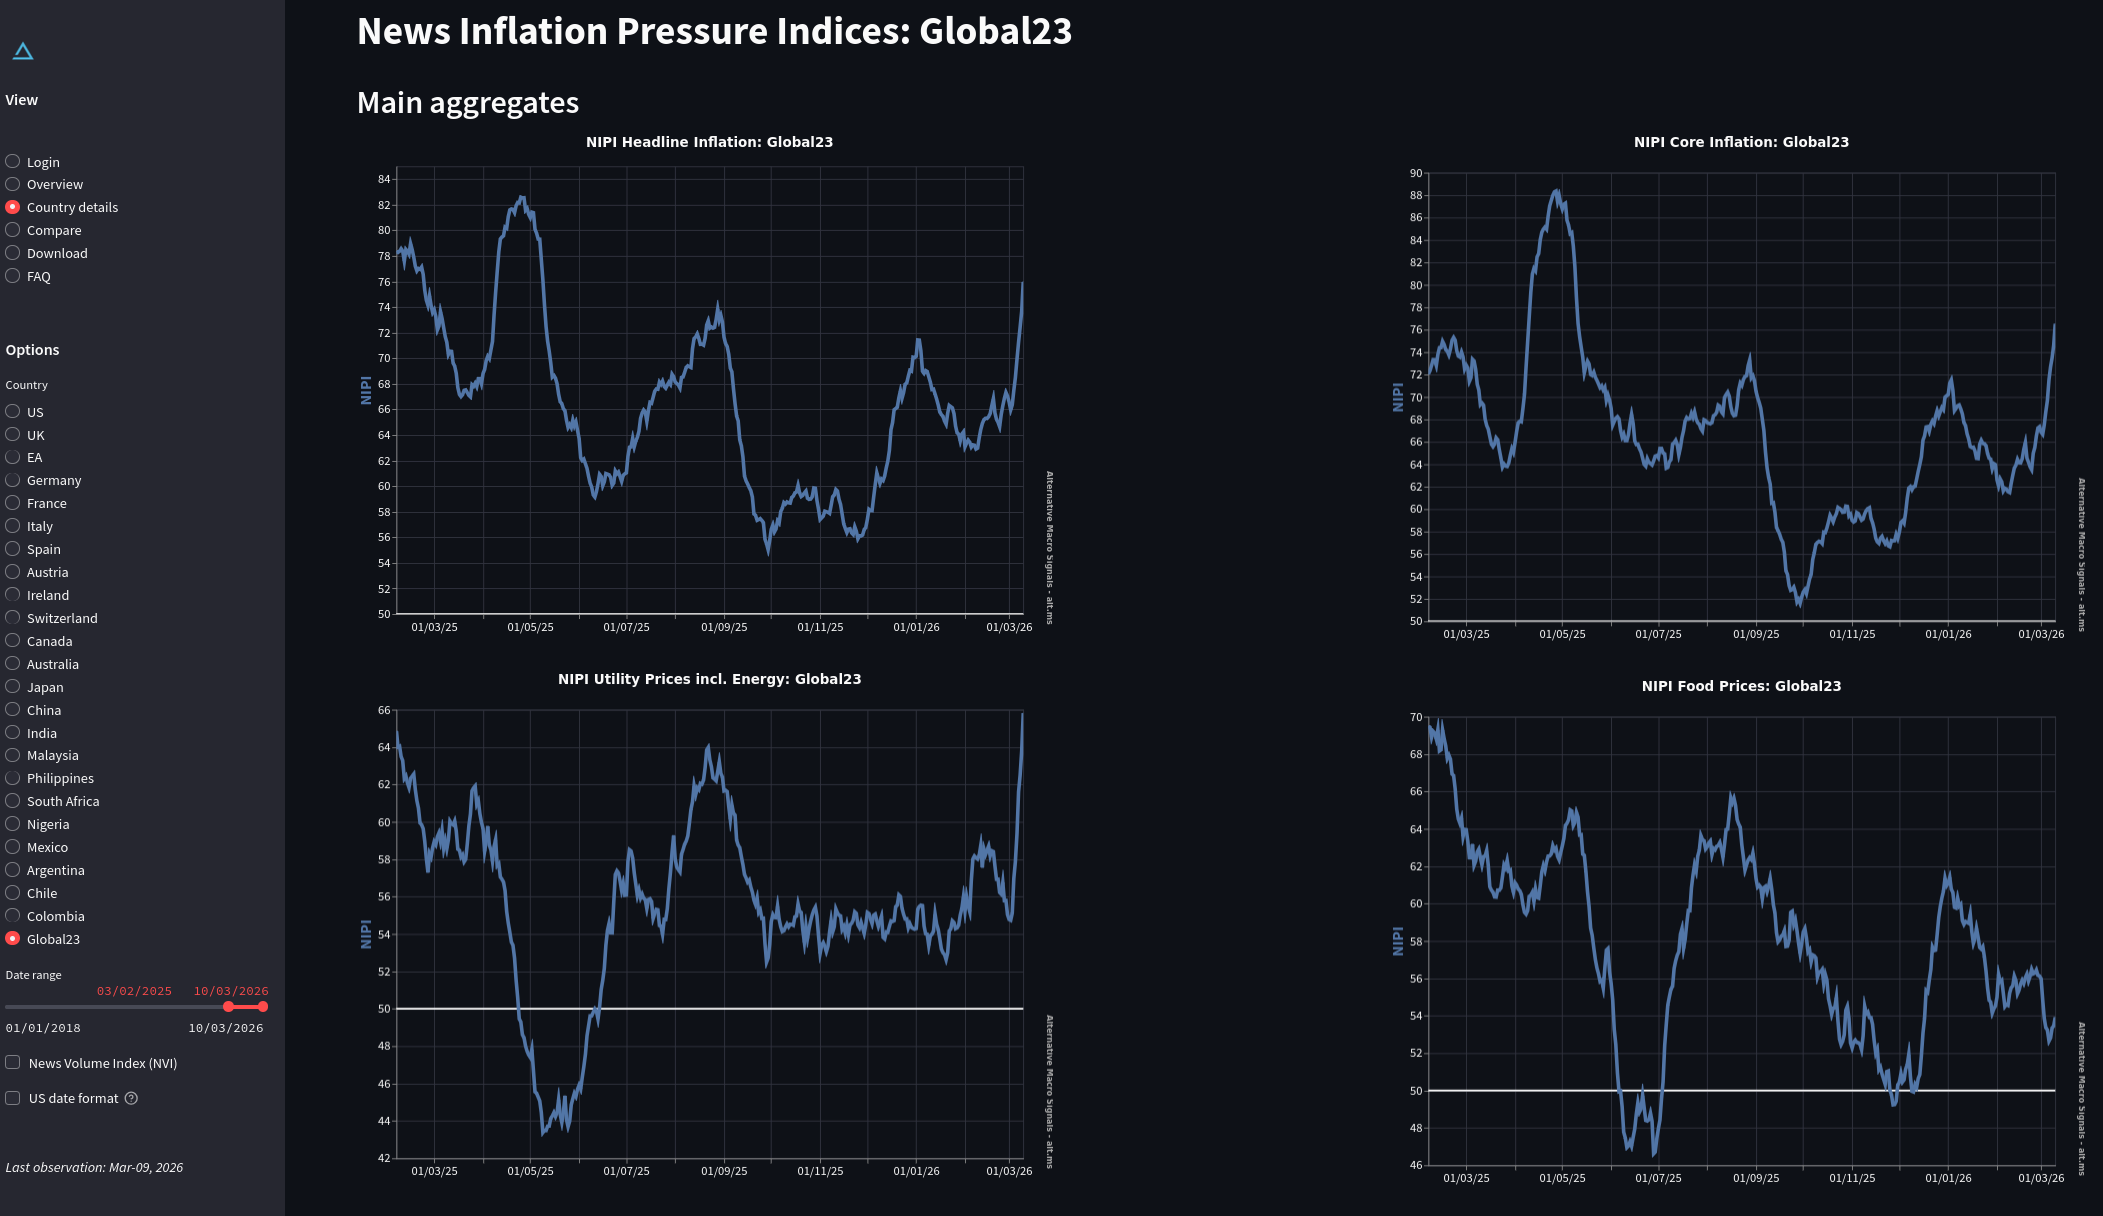
It is a key aggregate in our dashboards and modelbased tools, and it plays a central role in many of our applications.
Illustration 1: View from the online NIPI dashboad
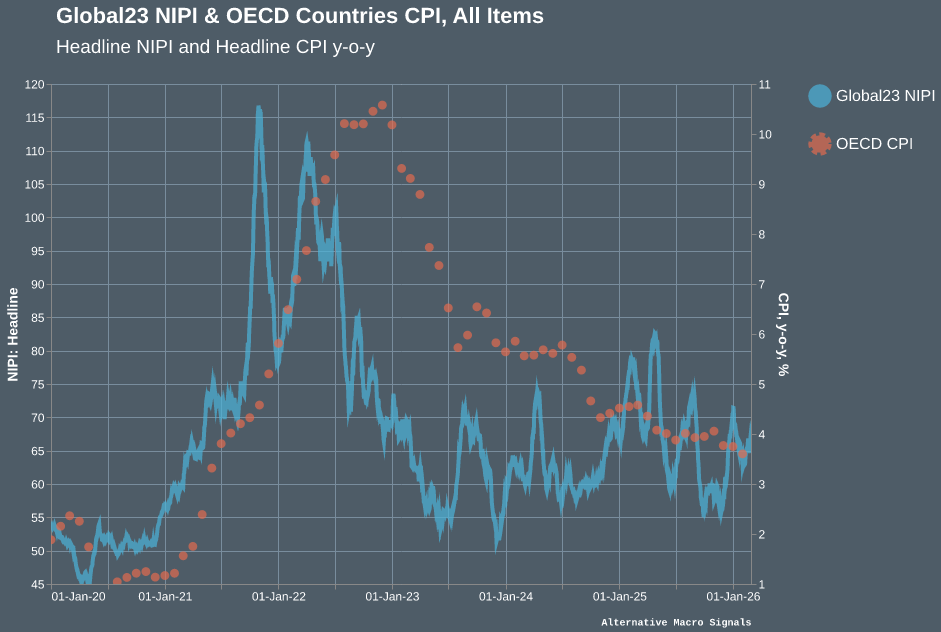
Global23 NIPI and OECD CPI
We focus here on the comparison between Global23 and headline CPI in the overall OECD region, which is one of very few global official inflation data (not exactly “global” since it is limited to OECD economies, but close enough).
Since the OECD CPI releases typically come out with a lag of around one and a half month, the CPI series is shifted forward accordingly in the charts below, ensuring that the comparison is free of any look-ahead bias. The NIPIs are available pretty much in real in real-time, just one day after the date they refer to.
Chart 1 compares the NIPI and OECD CPI inflation on a year-on-year basis. The two series go through the same global inflation phases, while the Global23 NIPI moves at a higher frequency and over a wider range.
Chart 1: The Global23 NIPI and OECD Countries CPI, Headline, y-o-y
Comparing the NIPI with three-month over three-months (3m-o-3m) OECD CPI rate reveals the shorter-run dynamics more clearly. Year-on-year rates are inherently slow moving, as they accumulate information over twelve months.
To evaluate the inflation short-term momentum, we prefer to refer to 3m-o-3m, as a trade-off between timely momentum tracking and noise removal. In this setting, the Global23 NIPI daily frequency is precious: it is available pretty much in real time, while official CPI releases typically come out with a significant lag.
Chart 2: The Global23 NIPI and OECD Countries CPI, Headline, 3m-o-3mo
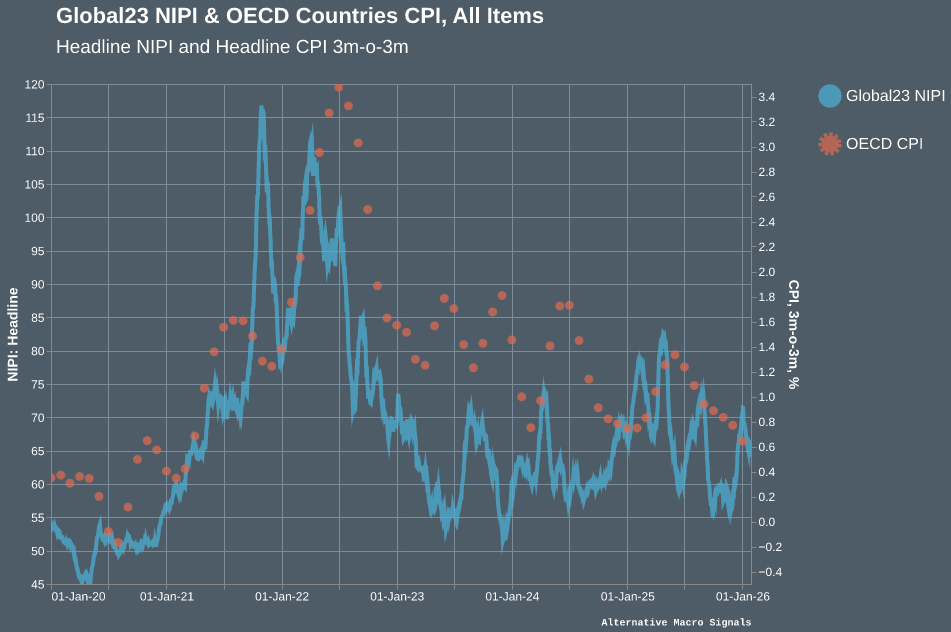
On that basis, the co-movement between the two series is more pronounced around turning points, and recent movements in both series are easier to read than on a year-on-year basis. The observation matches our earlier analysis concluding that the NIPI usually leads inflation over a 1 to 3 months window.
Using the Global23 NIPI for prediction
In order to test the forecasting poser of the Global23 NIPI, we can link the Global23 NIPI to OECD headline inflation through a time-series model, specifically an ARIMAX, which extends a standard autoregressive model by allowing external variables to enter as inputs, such as lagged NIPI. We can thereby assess whether news-based inflation signals translate into measurable movements in realised CPI in the months that follow. Several configurations have been tested1, including alternative lag structures and seasonal adjustment variants; the results below illustrate our preferred specification.
To evaluate the model before putting it to use, we ran out-of-sample predictions: each specification is re-estimated at 22 successive cut-off dates and used to produce three-month-ahead forecasts at each point. The chart below shows the results for M_seasonal, which tracks the broad direction of realised inflation reasonably well across the sample.
Chart 3: Out-of-sample forecasts - ARIMAX(1,0,0) + NIPIt-1+ dummies
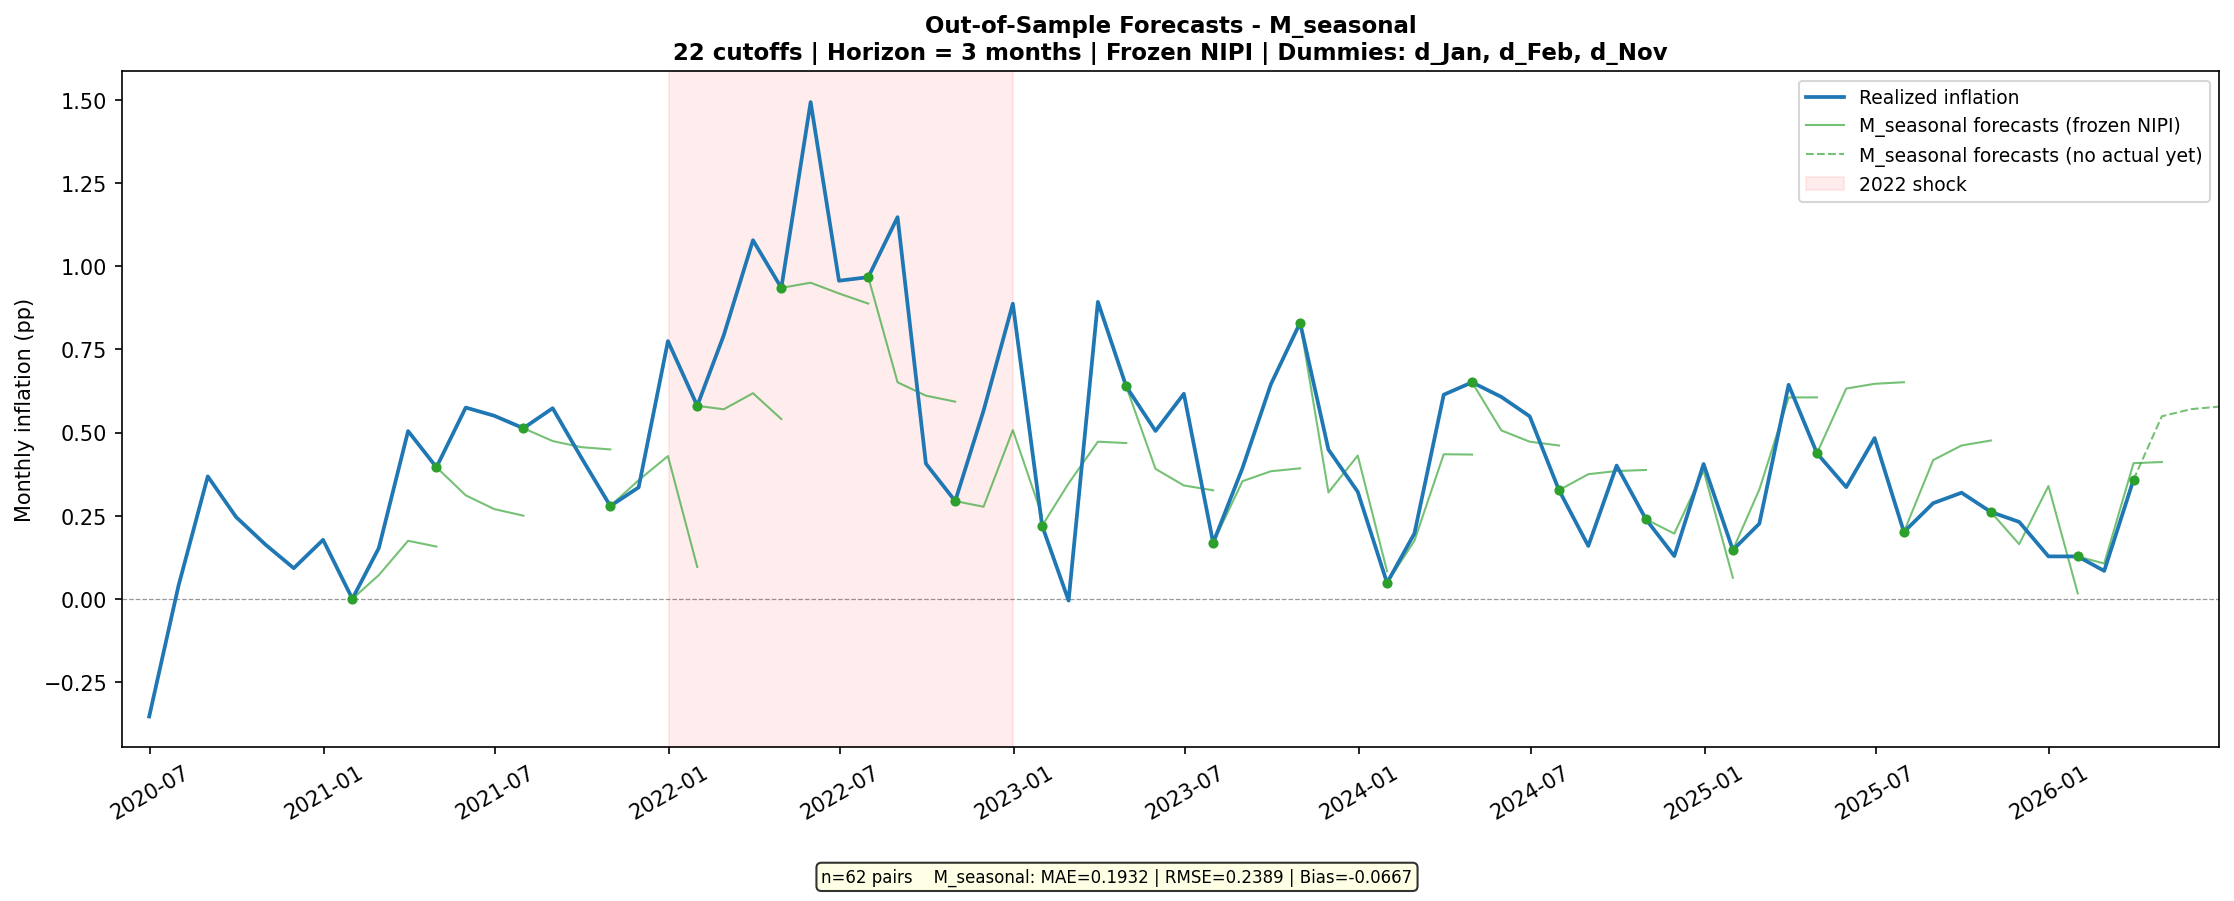
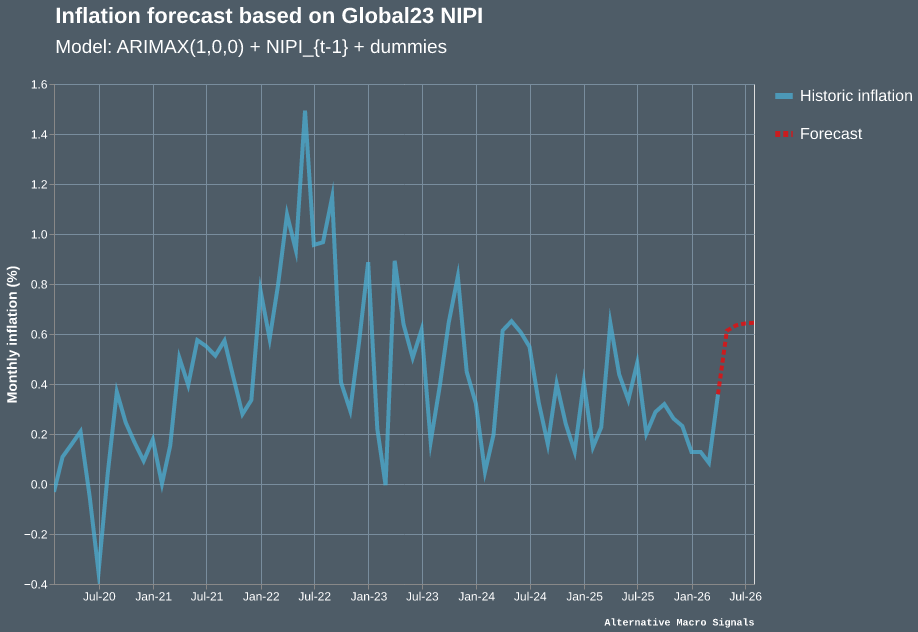
The simulations are done with “frozen NIPI levels”: the charts should read as indicating which inflation forecast should be expected assuming the Global23 NIPI level stays unchanged from the last available observation. Such model can be run in near real time to produce an updated forecast whenever new NIPI data become available.
The chart below shows the model’s output as of 16th March 2026: historical monthly inflation appears in blue, and the model-based projection for the coming months in red. This provides an early read on where global inflation may be heading (assuming stable NIPI levels), ahead of official CPI releases which will only be available in several months.
Chart 4: Inflation forecast based on the Global23 NIPI - ARIMAX(1,0,0) + NIPIt-1 + dummies
Taken together, these examples show how the Global23 NIPI can serve both as a real-time monitoring tool and as an input to simple forecasting exercises. Whether used alongside official CPI data or as part of a model-based projection, it offers a timely and tractable way to track global inflation pressures across a broad set of economies.
If interested, register here to receive the Monthly Global23 NIPI report in your mailbox.
↩ 1 Two specifications are estimated: a baseline ARIMAX(1,0,0) with lagged NIPI as the sole exogenous variable (M1), and a version that adds monthly dummies for January, February and November, selected at the 10% significance level, to capture seasonal regularities (M_seasonal). M_seasonal improves on the baseline across all metrics (RMSE out-of-sample: 0.17 vs 0.18; AIC: −31 vs −10), and is the specification shown in Charts 3 and 4.
To know more about our data,reach out.
