Our News Inflation Pressure Indices provide timely insights into a broad-based emerging inflation shock in the euro area - as they did for the US two to three quarters ago
Euro area inflation pressures had remained more muted than in the US until around the middle of the year. The uptrend was there - most of the inflation shocks are global after all - but supply side pressures seemed to have had a smaller effect on overall prices than in the US.
Experienced observers of global inflation would know: this is a common sequence.
Indeed, US inflation is more volatile and, in many ways, more "reactive" to supply and demand shocks. But that doesn't mean these shocks do not ultimately impact on the euro area economy. And when they do, they would often do so with more lasting (persistent) effects.
We have reached a point where upside pressures are significantly building-up in Europe. The UK was slightly ahead - it has its own set of aggravating factors following the EU exit - and the euro area as a whole is catching up now.
This can be illustrated by our News Inflation Pressure Indices (NIPI). The NIPIs read like a "PMI for consumer prices" (50 is neutral) and are based on news analysis from all corners of the global economy. The data is daily. To build a euro-area proxy, we compile news from Germany, France, Italy and Spain (76% of the euro area together). See the note below for further methodological details.
Energy and Food Components
The NIPI illustrates how energy prices are becoming a major source of concern in the euro area. Spain has been leading with a sharp rise in electricity prices in Q2: its consumer prices are more reactive to wholesale price developments. It has also shown the way for the policy response: not much can really be done to durably control energy prices themselves, so governments will find it easier to offer subsidies to sweeten the shock (eg France now).
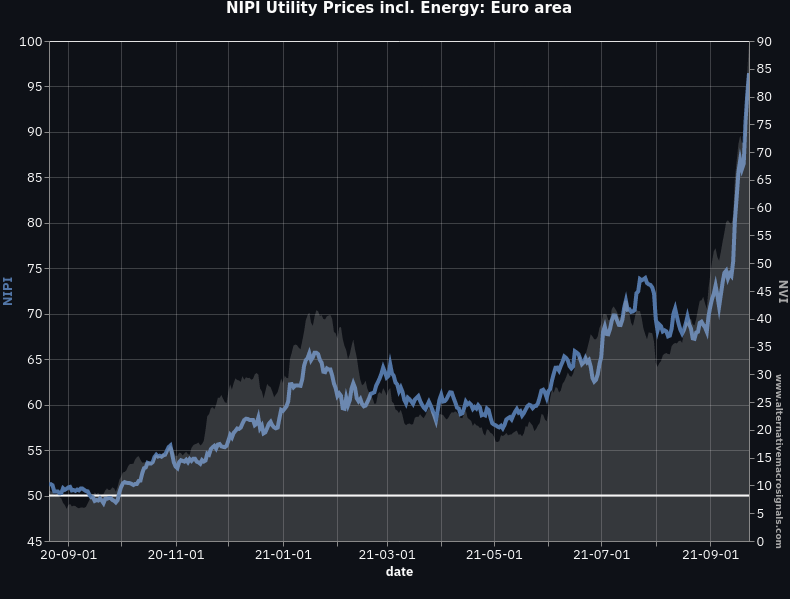
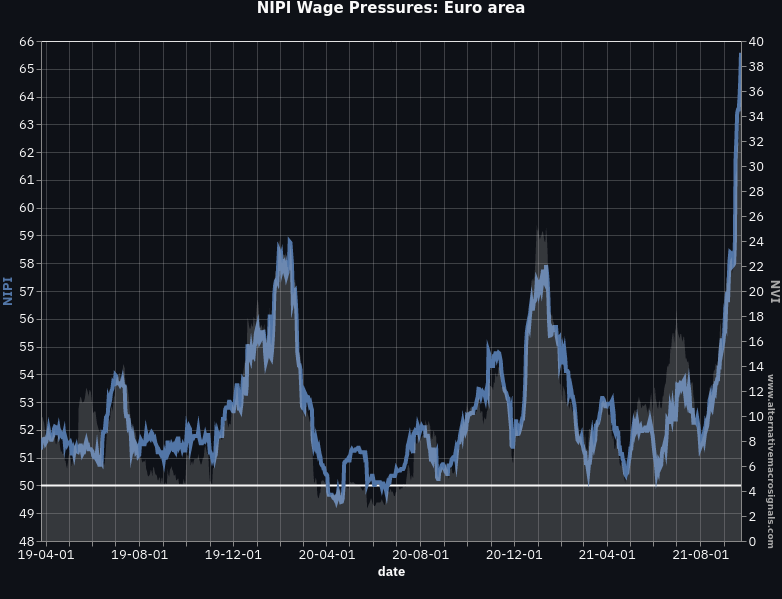
NIPI (LHS, blue line): News Inflation Pressure Indices (50 = equal volume of positive and negative news)
NVI (RHS, grey bars): News Volume Indices, a measure of the overall volume of inflation news in the sector and country (0 = no news)
In any case, energy prices are significantly up and they are very likely to be passed on to final goods and services, because the shock is too large to be completely buffered by margins.
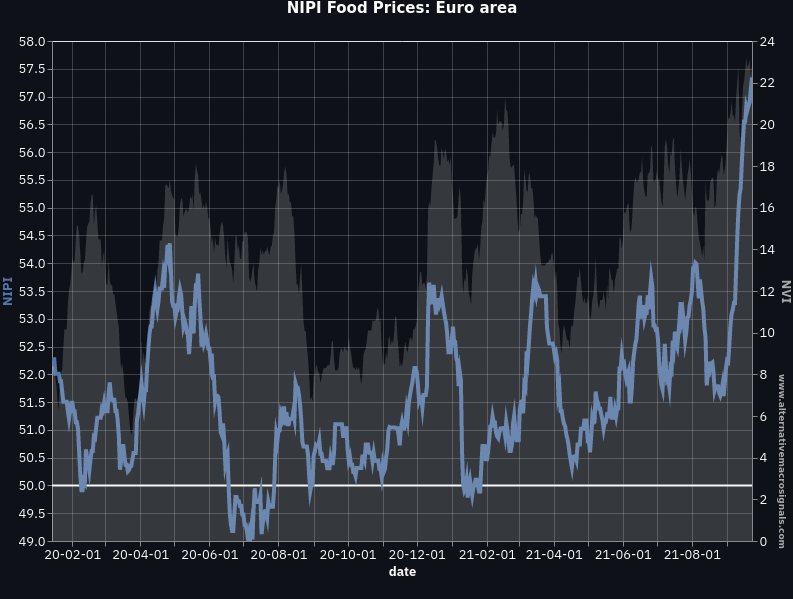
Underlying food prices are at their highest since the pandemic start. Supply constraints and weather effects are the main causes. There are also new reports about how energy price increases can impact food costs (through substitution effects or fertilizer prices).
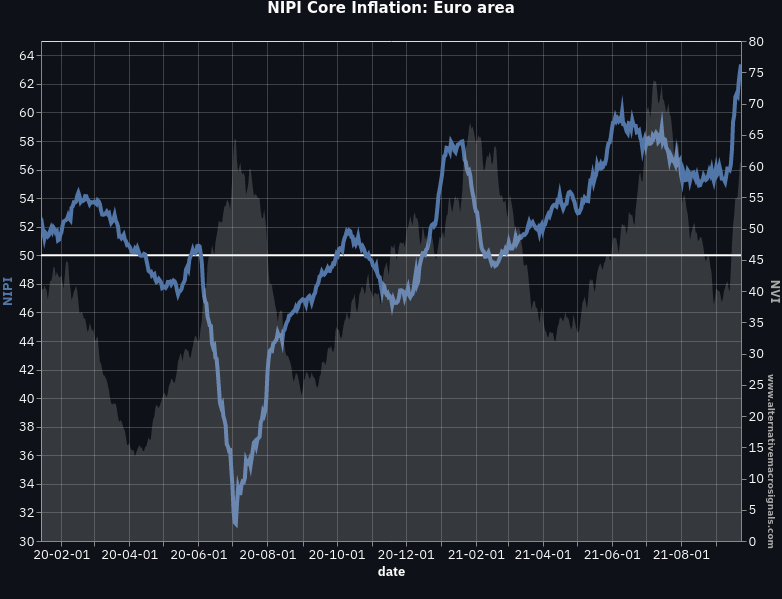
Finally, core inflation (ex food and energy) pressures are building up, albeit still more slowly for now. The same shocks as elsewhere are taking place now (car prices, rental prices, electronic equipments etc), with the additional (and specific) twist of indirect effects from energy prices to other goods and services.
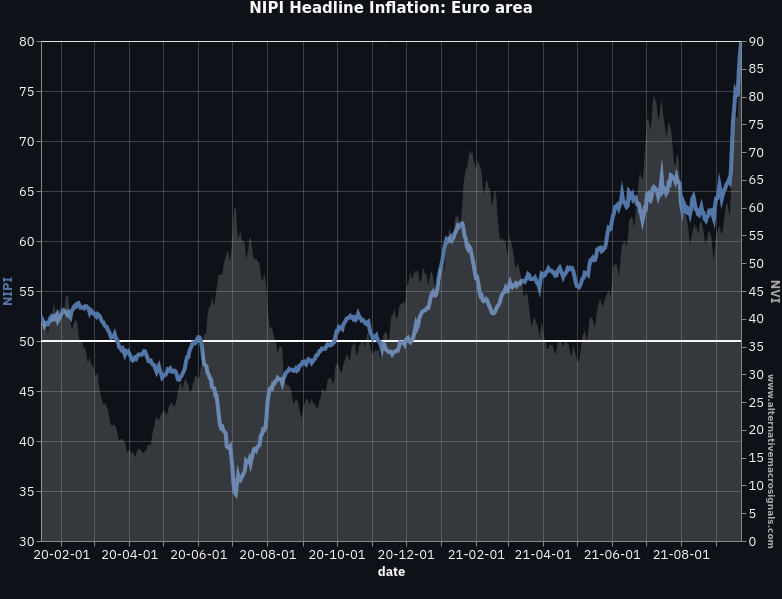
As a result, upside pressures on headline inflation in the euro area are reaching record high levels.
Remember: the NIPI measures the inflation noise in the news, in a timely fashion. It is likely to be indicative of inflation expectations in the real economy.
Inflation expectations seem to be in the process of adjusting. For instance, the shocks are beginning to feed through to wage pressures: our NIPI-Wages is at its highest in years because the rise in headline inflation is starting to feed through to minimum wages (France) and forthcoming wage negotiations (Germany).
Our takeaway: the inflation shock has clearly impacted Europe now. Like in the US, its magnitude and breadth suggest it will have more lasting effects than consensus had anticipated.
More on the data
The News Inflation Pressure Index (NIPI) measures the directionality of the news flow. When the NIPI is at 50, positive and negative news balance each other. When the index rises above 50, the news flow signals positive inflation pressures are building up, and vice versa when the index drops below 50.
The data is available daily for the following countries: US, UK, Euro area, Germany, France, Italy, Spain, Canada, Australia, India, South Africa, Mexico and Argentina.
And the following sectors: headline inflation, core inflation, energy, food, telecom services and wages.
The NIPIs are based on state of the art Natural Language Processing applied to hundreds of thousands of news sources in six languages (Chinese, English, French, German, Italian and Spanish).
The Inflation NewsBot provides a daily selection of news relevant to the near-term inflation forecast which then enter in the NIPI calculation.
For any inquiries, including trial request, you can use our contact form.
