US Inflation eased in July and surprised consensus to the downside, for the first time in long while.
Prior to that, our NIPI indicator had gone a good job signaling upside risks.
How good is the NIPI on the way down now?
The below charts show the NIPI (white line) and the US CPI releases (month-on-month changes SA, red dots) as of release date. The July CPI is reported on the 10th of August, when the US Bureau of Labor Statistics released the data. The NIPI is daily and available without lag.
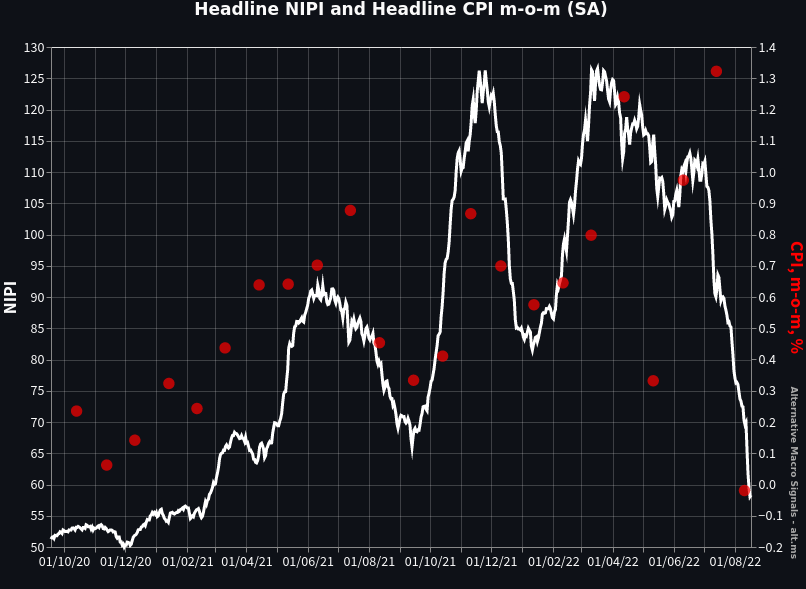
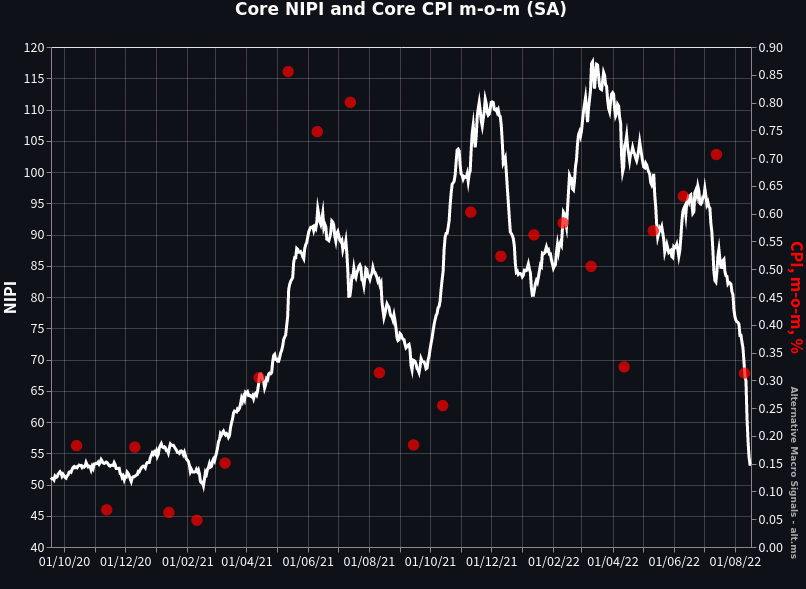
The NIPI has started to signal some easing as early as the first week of July, which was almost 10 days before the June CPI release. Both core and headline NIPI have kept falling since then - which materialised in the July CPI print.
In short, there is no bias in the NIPI here. It has been signalling a negative turning point in a timely fashion, with the usual one to two months lead.
Read more:
Inquiries: reach out
