Our news-based indicators have correctly predicted the recent US CPI path. And they continue to point towards persistently strong price pressures.
One way to evaluate the NewsBot and derived NIPI data is to compare the latter with official CPIs, since they are meant to capture news relevant to the near-term inflation forecast. They should be pointing in the right direction with some lead.
The below charts show the US CPI alongside the NIPI. We compare month on month rates in CPI with the NIPI levels. The comparison is supposed to be tough on our data because m-o-m CPI rates are very volatile.
The CPI data is shown as of release date, so that we can compare the data in "real-time", as they would be known at the different point in time.
A simple case of letting the data speak for itself:
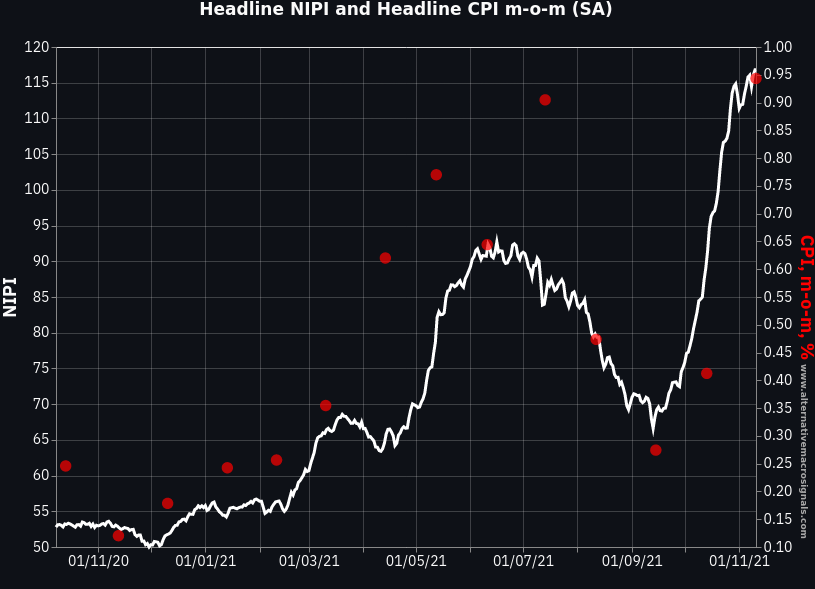
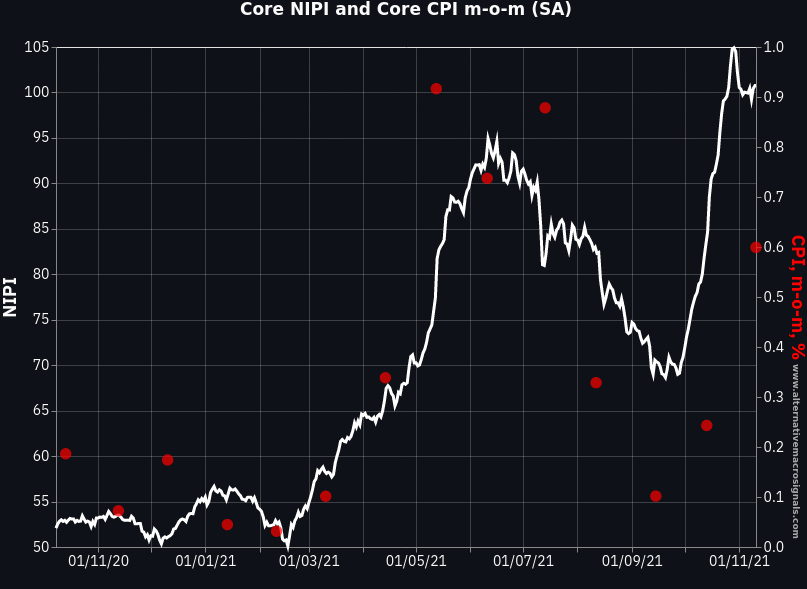
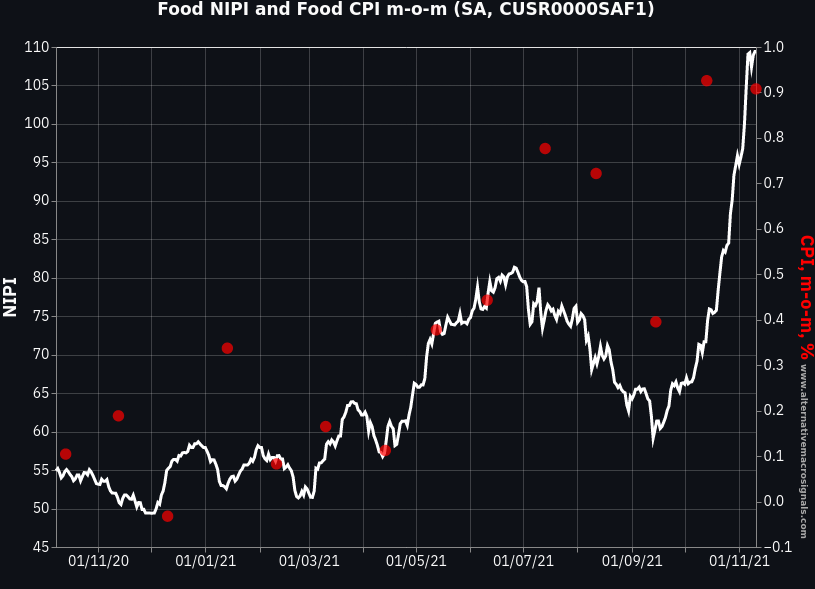
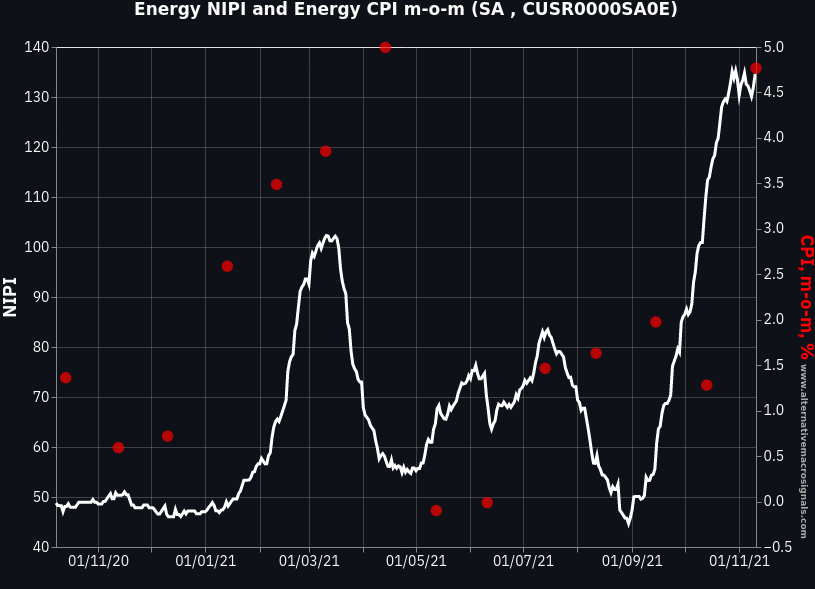
As of writing, none of our indicators suggest the inflation shock is fading.
Notes
The News Inflation Pressure Index (NIPI) measures the directionality of the news flow. When the NIPI is at 50, positive and negative news balance each other. When the index rises above 50, the news flow signals positive inflation pressures are building up, and vice versa when the index drops below 50.
The data is available daily for the following countries: US, UK, Euro area, Germany, France, Italy, Spain, Canada, Australia, India, South Africa, Mexico and Argentina.
And the following sectors: headline inflation, core inflation, energy, food, telecom services and wages.
The NIPIs are based on state of the art Natural Language Processing applied to hundreds of thousands of news sources in six languages (Chinese, English, French, German, Italian and Spanish).
The Inflation NewsBot provides a daily selection of news relevant to the near-term inflation forecast which then enter in the NIPI calculation.
For any inquiries, including trial request, you can use our contact form.
