Note: a NIPI value of 50 is indicative of a balanced volume of positive and negative inflation news, a value above (below) 50 indicates positive (negative) inflationary pressures in the near-term.
The NIPI summarises near-term inflation trends from scanning hundreds of thousands of news sources. It is not meant to be an inflation forecast by itself, but it turns out to be a very reliable turning point indicator.
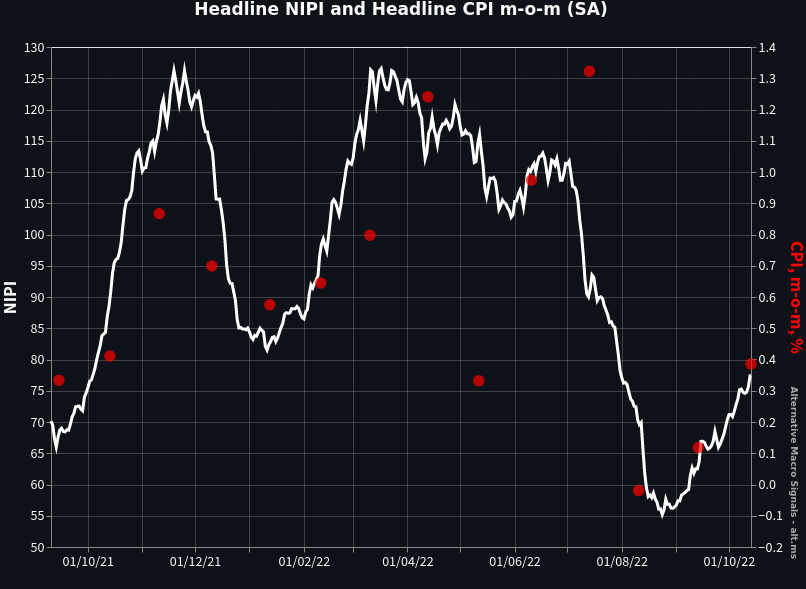
The above chart reports:
- the NIPI for headline inflation in the US
- the official US Headline CPI Inflation release (month-on-month, seasonnally adjusted)
The NIPI is shown "as of release date", i.e. the last red dot on the chart is the September CPI number which was released on the 13th of October 2022. The NIPI is released in real-time.
Read more about the NIPI databases and the Inflation NewsBot.
If you are interested in our unique inflation data, you can reach out here.
