We present four different ways to track and analyze inflation turning points, using the quantified signals from our datasets

Our goal is to reduce complex information into signals that can be processed and acted upon.
There are limits to simplification, however, including our own ability to foresee the next issues.
For that reason, we provide as much data as is reasonable, while highlighting what we think are the most future-proof metrics.
There is our flagship NIPI diffusion index for that purpose. It has done the job of tracking inflation turning points on a daily basis, through unexpected COVID shocks. In addition, there are a few hidden gems in our databases, from different ways to aggregate the NIPI, to more unusual measures which can be tailored by text queries.
Here are four ways to look at our quantified signals, from aggregate to specific.
News Inflationary Pressures Indices (NIPI)
Our flagship inflation turning point indicator. Updated daily.
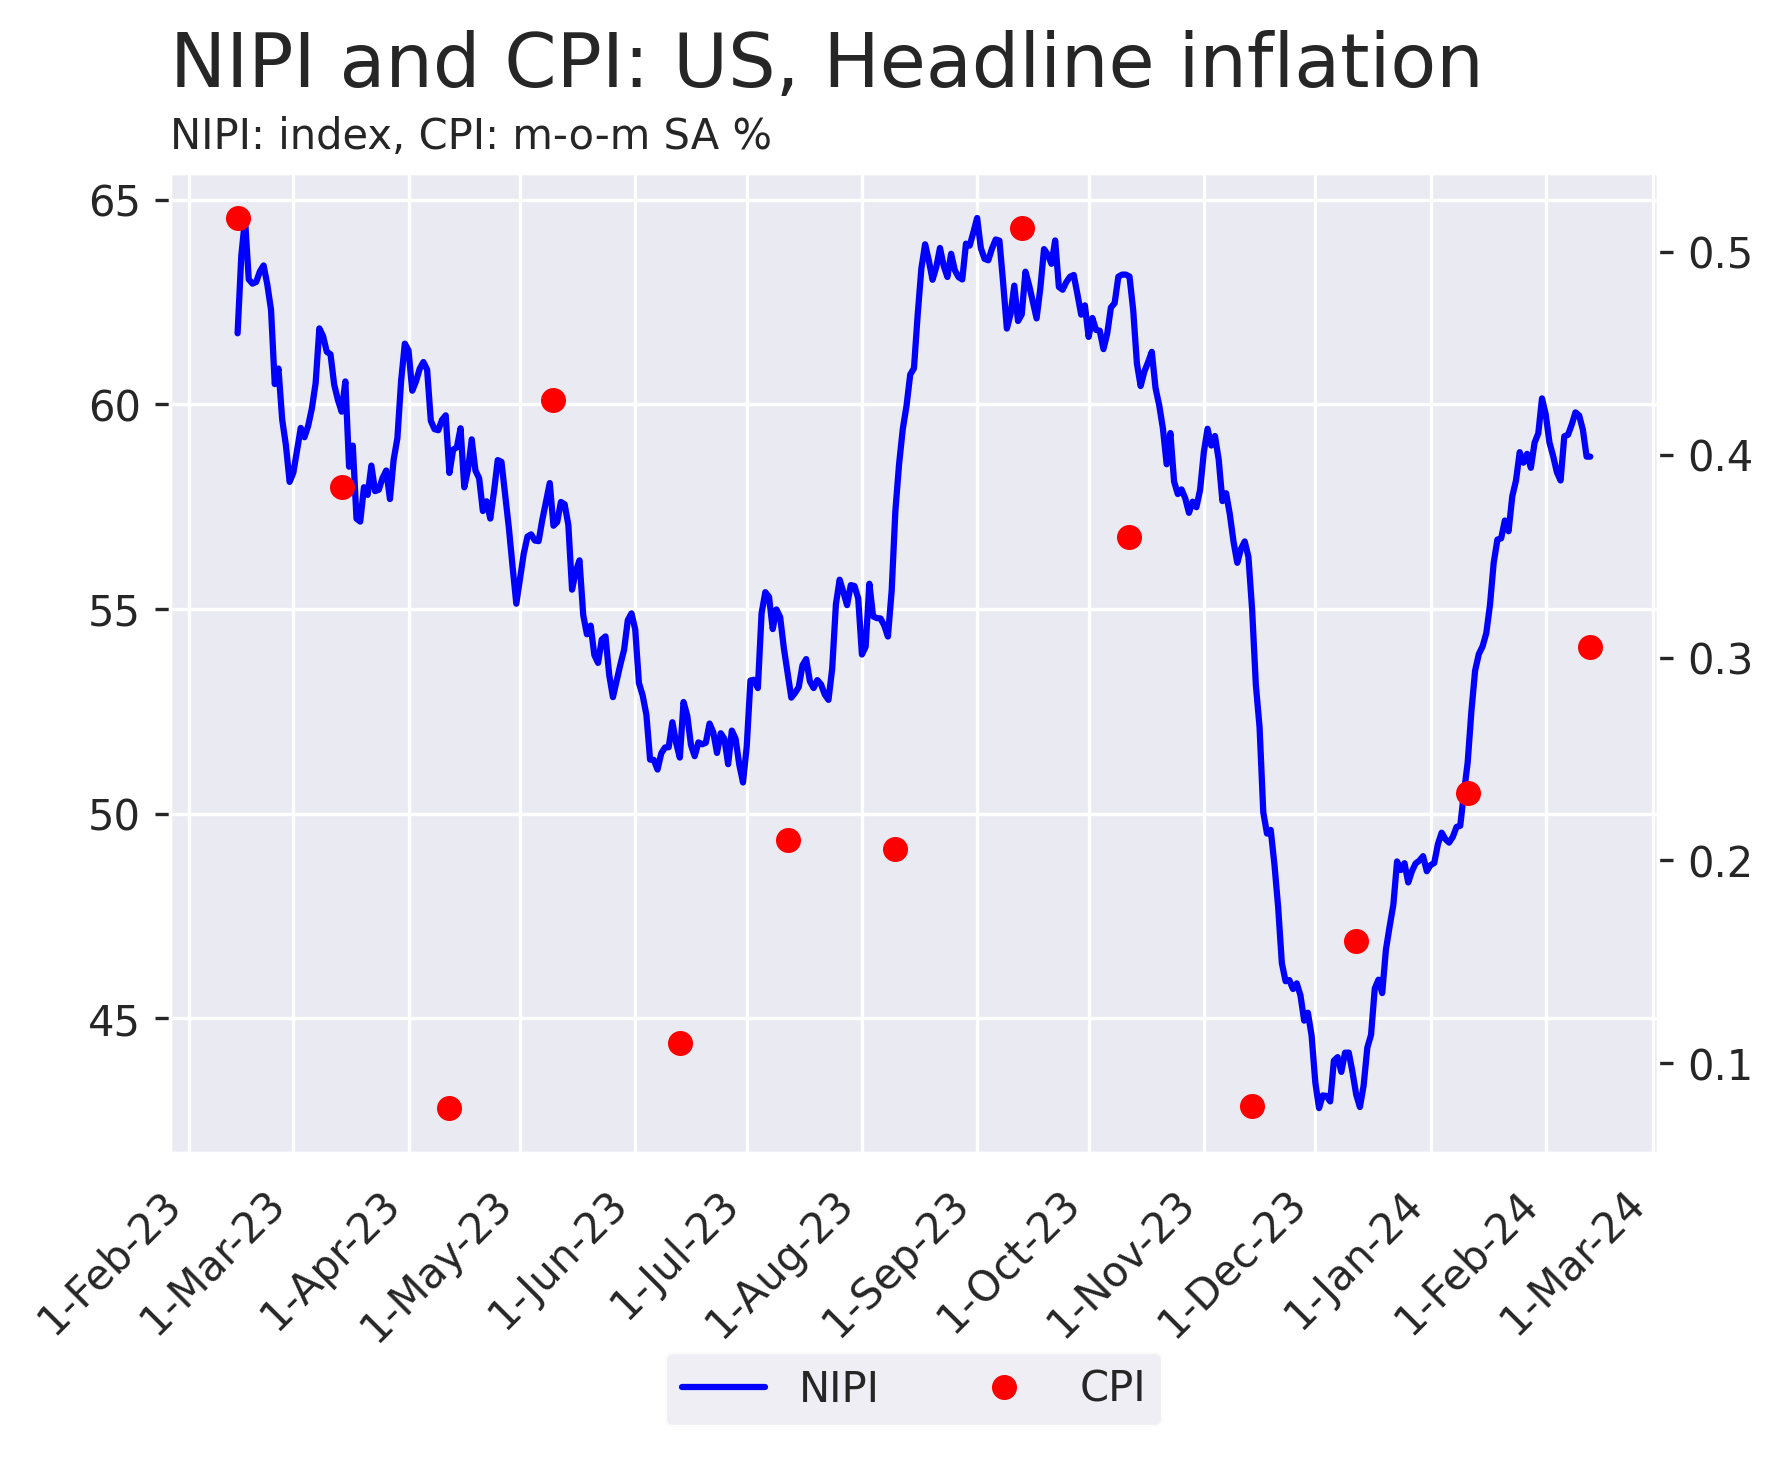
Definition The NIPI is a diffusion index, showing the difference between the volume of positive and negative news in a country and sector over a 30-day period. The measure is standardised and centred (50=neutral), to facilitate analysis over time and between countries.
Purpose Leading turning point indicator.
Example US Headline NIPI and US CPI month-on-month, as of release date.
Availability Daily frequency. Released next day. 6 years of history (1/1/18 start), 15 countries. Downloadable CSV files and visualisation app. "NIPI" database.
Read more Data description; our blog.
Positive and Negative News Breakdown
Analyze turning points.
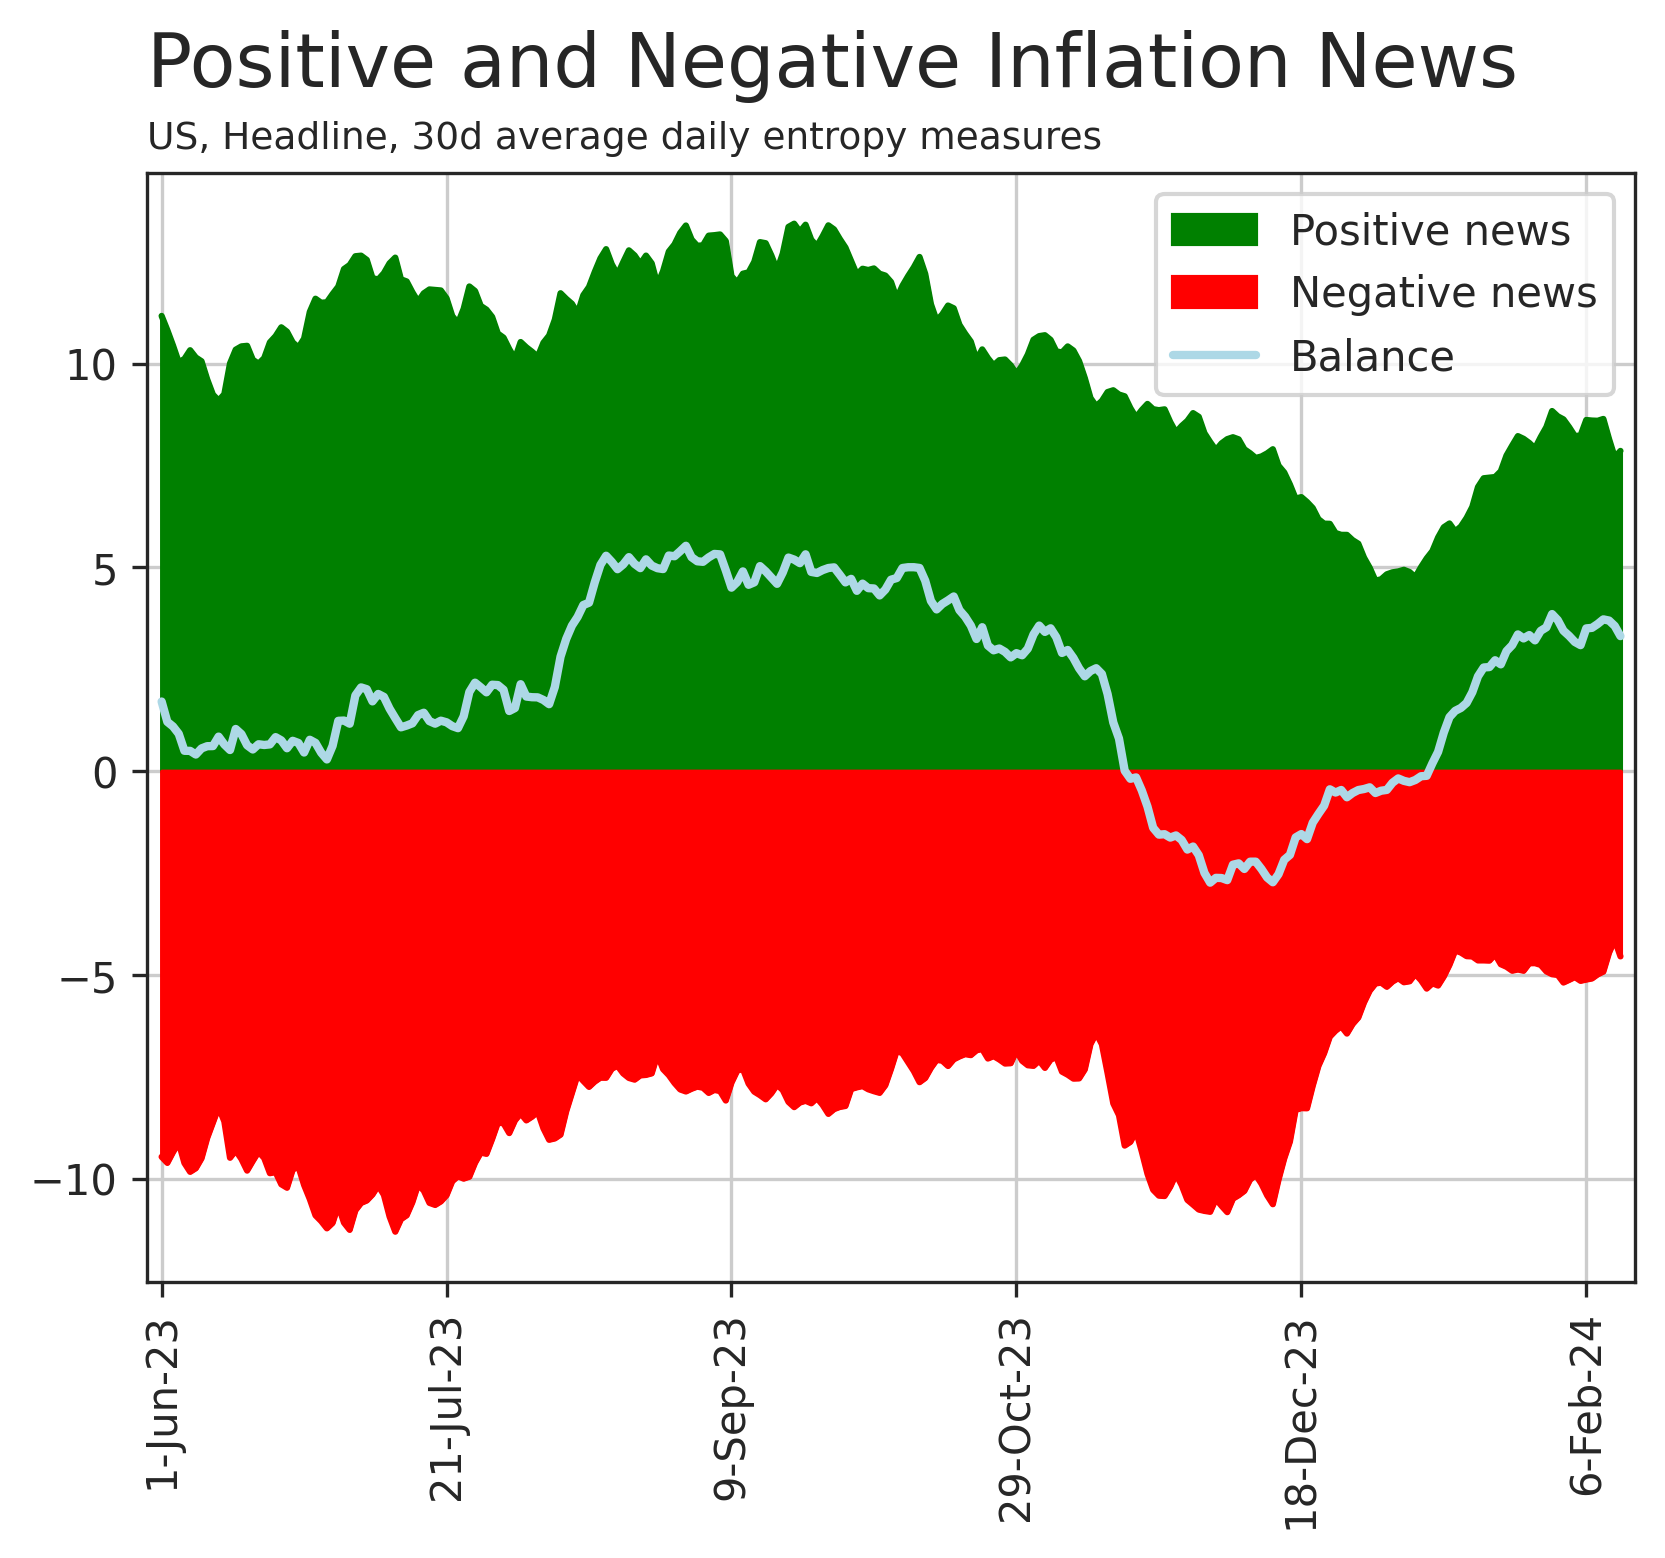
Definition The positive and negative news volumes entering the NIPI can be seen separately. They are calculated as the sum of the probabilities of news being positive or negative, with the same country and sector breakdown as in the NIPI.
Purpose Investigate NIPI changes.
Example US Headline inflation, positive and negative flows. The chart illustrates that the NIPI drop in Nov-23 (equivalent to the "Balance" line below) was in part due to an increase in negative news volumes and a drop in positive news volumes. An analysis of previous November periods (not visible on the chart) can reveal a larger than usual "Black Friday" sales news volume.
Availability Same as NIPI. The database is called "entropy".
Diffusion Indices With Adjustable Time Windows
Optimize the NIPI for forecasting purposes... forecast the turning point indicator.
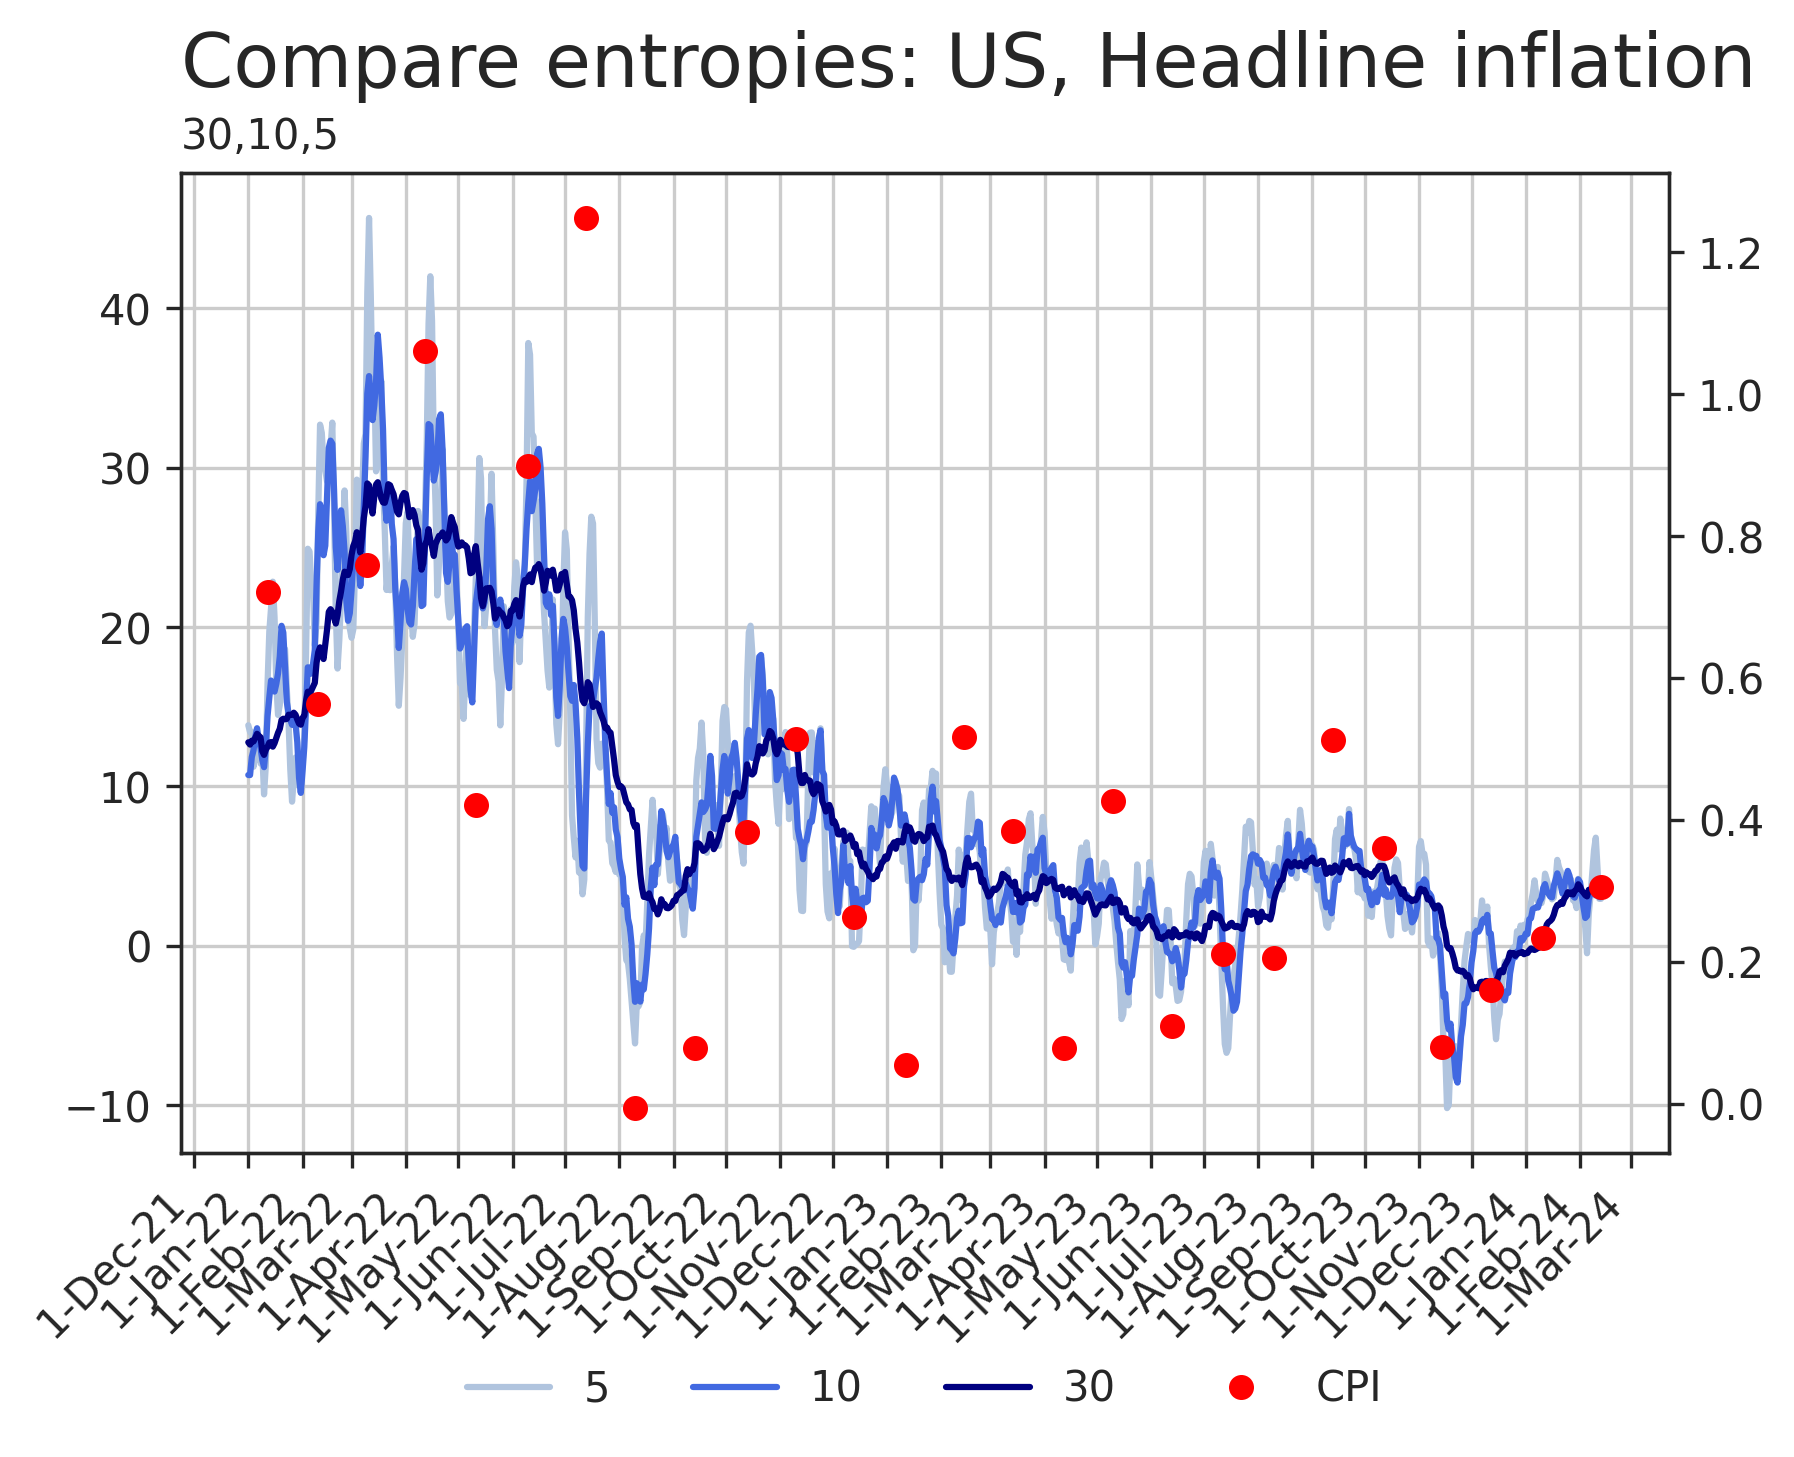
Definition Balance of positive and negative news volumes over shorter or longer time windows than the 30-day used in the NIPI.
Purpose Changing the time window provides a different timeliness / noise trade-off. A 30d window is a pretty good starting point in most use cases. But it may be useful to look at shorter periods where the news volume is very high (US, Euro area, Japan, China...), for a more forward-looking signal; while longer windows may be useful in smaller economies with smaller news sample (for instance, Australia).
Example The below charts shows 5, 10 and 30-day balances of positive and negative news in the US, compared with CPI releases m-o-m (as of release date).
Availability Same as NIPI. The database is called "entropy".
News Balances
Time-series from text queries, for granular item-level analysis
Definition Ratio of positive and negative news volume at the product level.
Purpose To study specific items, identify the factors behind NIPI changes. Key input in a bottom-up inflation forecast.
Example This works a bit differently than the above databases: rather than a pre-defined time series, the user formulates a news search, for instance "electricity" from relevant news articles about inflation in Germany. This returns the ratio of positive and negative news associated with the query. The News Balance ranges between -1 and +1, 0 being a balanced volume of positive and negative news.

Availability Queries can be formulated and the data downloaded from our new "NewsBot App". The last 24 months are available. Frequency is daily. 30-day and 7-day windows are calculated.
Read more Introducing the News Balance; International car price dynamics.
Request a demo or trial: here.
