The Global23 NIPI is designed to capture short-term inflation pressures at the global level. To test how useful that signal really is, we need a benchmark that operates on a similar global scope. The OECD Economic Outlook is arguably the most established forecasting exercise at that scale. The geographic coverage does not perfectly match, but both capture the same broad inflation dynamics. Using the Global23 NIPI as input to a simple ARIMAX model, we test whether it carries a genuinely useful short-term inflation signal at the global level.
Published twice a year, the OECD Economic Outlook draws on structural models, expert judgment, and country-level intelligence to produce forecasts widely used in policy and economic analysis. In stable macroeconomic conditions, these forecasts are remarkably accurate. But the semi-annual publication cycle has a built-in limitation: when inflation accelerates or decelerates sharply, the latest Economic Outlook can prove rapidly outdated. The 2021-2022 inflationary surge made this particularly visible.
The NIPI (News Inflation Pressure Index), aggregated across 23 major economies into the Global23 composite, offers a different profile. Updated in near-real time, it captures shifts in inflation dynamics before they show up in official data. In a previous note, we introduced a simple ARIMAX model using the Global23 NIPI to forecast short-term inflation. Here, we take that exercise further by measuring how the NIPI performs against some of the most demanding benchmarks in inflation forecasting.
We put the NIPI model's quarterly inflation forecasts alongside the OECD Economic Outlook and an ARMA(1,1) benchmark over 2021-2025. Both are notoriously difficult to outperform at short horizons. Any improvement over either would be a meaningful result.
Benchmarking procedure
Measuring how a lightweight statistical model performs alongside an institutional forecast raises immediate methodological challenges: different scales, different publication schedules, different data vintages.
The OECD regularly revises its CPI series as weightings, methods, and base years evolve. This means index levels are not directly comparable across vintages. The solution is to work with quarterly growth rates (q/q) computed within the same vintage, so that both the forecast and the reference quarter share the same base. The NIPI model follows the same logic: monthly inflation forecasts from our ARIMAX model are converted to a quarterly growth rate.
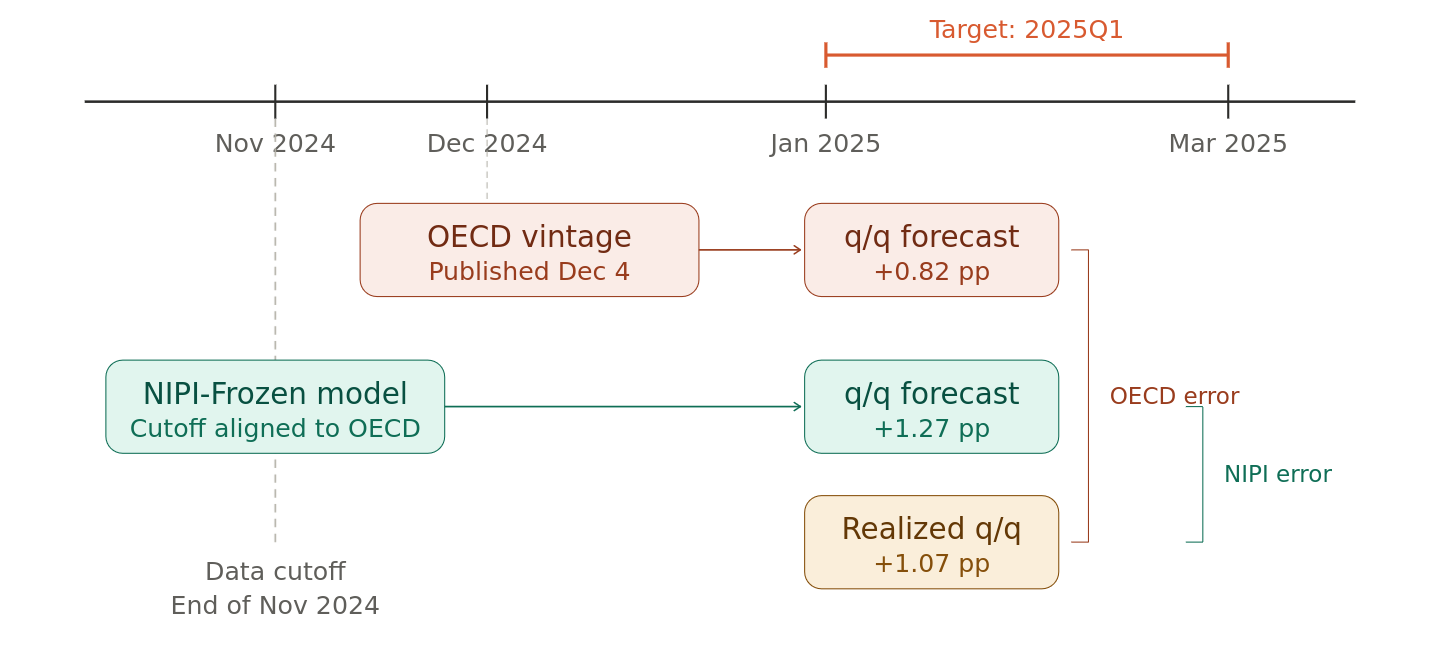
For each target quarter, we identify the last OECD Economic Outlook vintage published before the quarter begins. For instance, to forecast 2025Q1, we use the vintage published on December 4, 2024. Although released in early December, the data it incorporates run through the end of November. We align the NIPI model's estimation cutoff to the same date, so that both forecasts rely on the same information window. Each produces a q/q growth rate for the target quarter, and both errors are measured against the same realized CPI series.
Illustration 1: How does the alignment work ?
Reading the forecast errors
Because the Economic Outlook is published only twice a year and the NIPI Global23 forecast starts in 2021, this exercise yields 9 quarter pairs over 2021Q3-2025Q3. The sample is small by construction, and all patterns should be read as directional rather than definitive.The three panels below show forecast errors, their absolute values, and cumulative absolute errors for three specifications: the OECD Economic Outlook, NIPI-Frozen (which holds the NIPI constant at the cutoff date), and a pure ARMA(1,1) benchmark with no exogenous signal. All statistical models are re-estimated at each cutoff using only data available at that point, ensuring a proper out-of-sample exercise.
Chart 1: Forecast errors, OECD vs NIPI-Frozen vs ARMA(1,1)
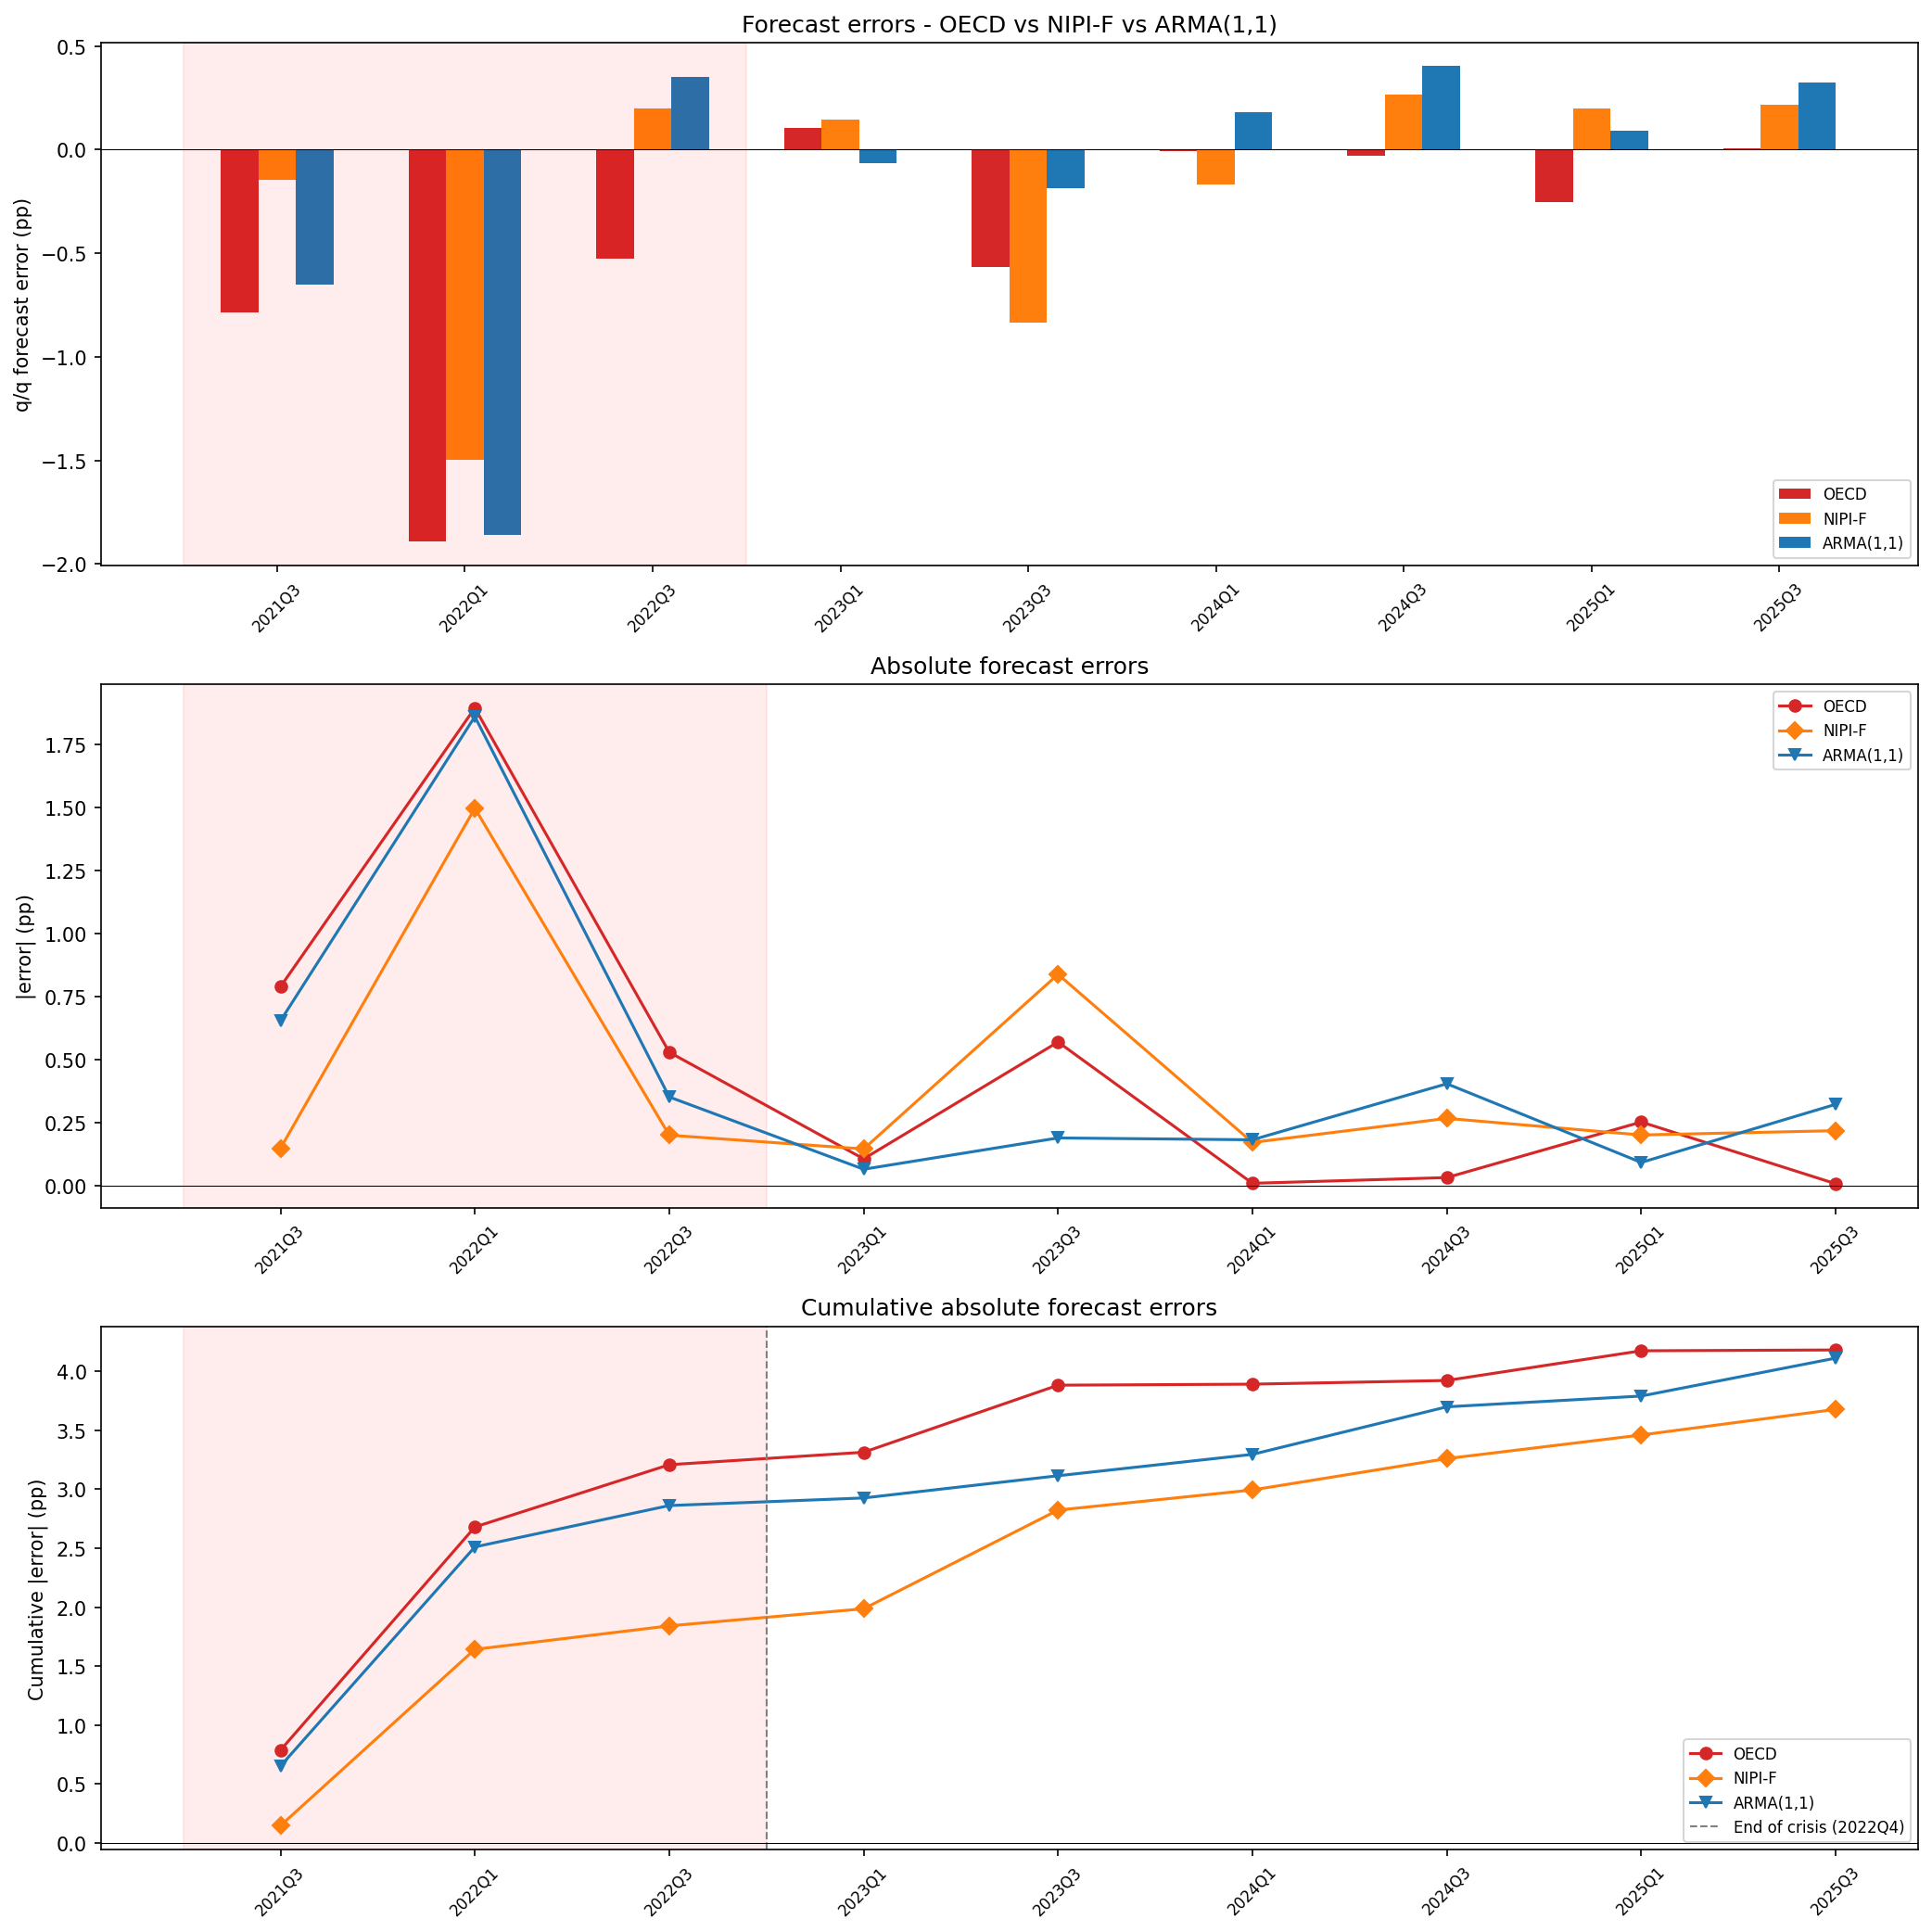
The shaded area marks the 2021-2022 inflationary surge. During that period, NIPI-Frozen consistently tracks inflation more closely than both the OECD and ARMA(1,1). Once conditions stabilize (2023 onward), the OECD takes over with smaller errors. The cumulative panel shows that the advantage NIPI-Frozen builds during the crisis is never fully erased afterward. The frozen specification is deliberately conservative: it holds the NIPI constant throughout the forecast window. To test whether allowing the NIPI to evolve dynamically improves on this, we ran an alternative specification where it is projected forward using its own recent dynamics.
Chart 2: Forecast errors, OECD vs NIPI-Frozen vs NIPI VAR
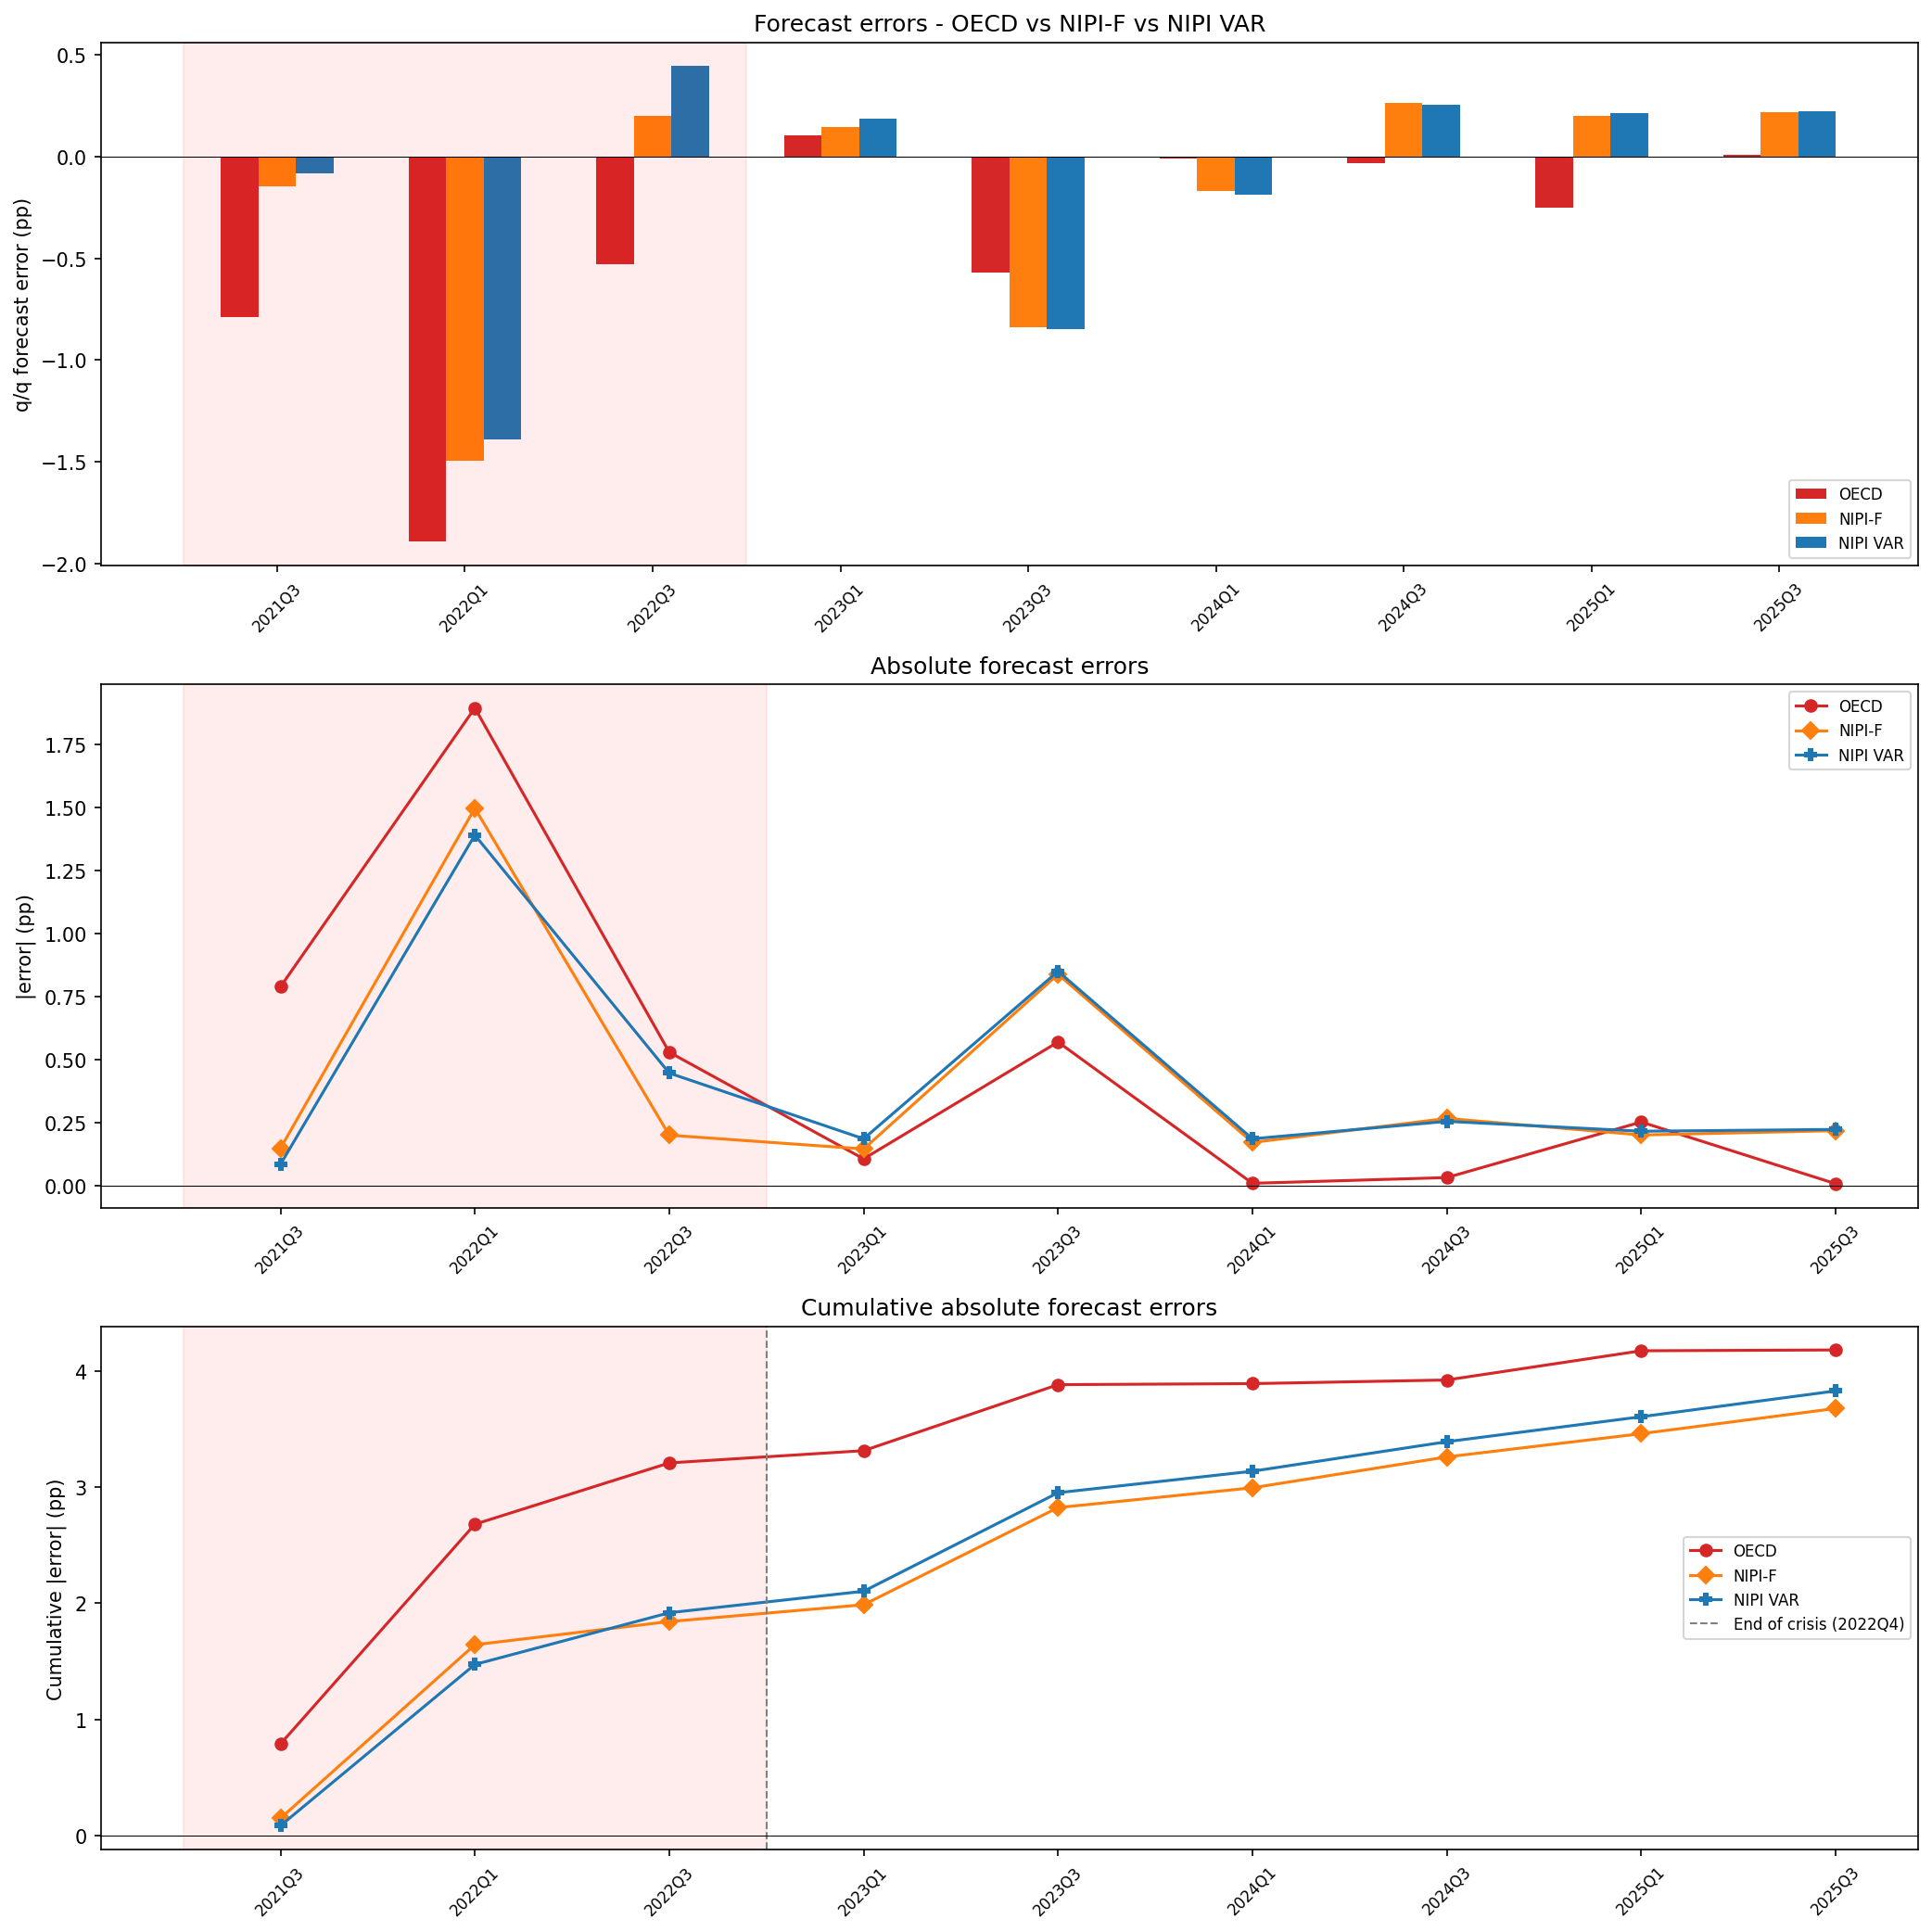
Whether the NIPI is held constant or projected forward, the results are nearly identical. Both variants follow a very similar trajectory throughout the sample, and both finish with lower cumulative errors than the OECD. This robustness matters: it means the results are not driven by a particular modelling choice for the NIPI path. On a larger sample, the VAR approach could reveal additional value by capturing turning points in the NIPI itself, but with only 9 observations the simpler frozen specification remains the safer operational choice.
Institutional forecasts and real-time indicators serve different roles. The OECD Economic Outlook draws on structural models, expert judgment, and country-level intelligence that no high-frequency index can replicate. The NIPI operates on a different timescale: updated daily, it captures inflationary pressures as they build, providing an early read between two publications. The 2021-2022 episode illustrates when this complementarity is most valuable: during regime shifts, when the inflation landscape moves fast enough that even a few months of additional lag can matter. For practitioners already monitoring the Economic Outlook, the NIPI adds an early-warning layer in precisely those moments.
It is worth noting that this exercise was particularly demanding on the NIPI. In our setup, forecasts are produced up to five months ahead, while the indicator is fundamentally designed for nowcasting. Despite this, the NIPI passed the test. In practice, it would not be frozen months in advance: as a daily indicator, it would update continuously throughout the quarter, providing far more current information than what this benchmark exercise captures.
Even beyond its intended scope, the Global23 NIPI delivered useful signals several months ahead. This provides strong evidence that it can serve as a reliable proxy for global inflation trends.
If interested, register here to receive the Monthly Global23 NIPI report in your mailbox.
To know more about our data,reach out.
