Combine the information from two of our timely inflation indicators to detect near-term turning points with higher confidence
The News Inflationary Pressures Indices (NIPI) are measures of near-term price pressures. They are the outcome of our large-scale automated analysis of news articles content. The NIPIs are built as "diffusion indices", which means that they compare the volume of positive inflation news with the volume of negative inflation news.
A 50 NIPI value implies that positive and negative news have balanced each other in the last 30 days. When the NIPI is well above (below) 50, positive (negative) news dominate.
When the NIPI drops from elevated levels, as has been the case in the US lately, two things can take place:
- some positive news are dropping out of the sample window (almost certainly)
- some negative news have emerged, offsetting prior negative news (occasionally)
It is important to know whether we have only the first phenomenon at play or whether price drops are traking place, too. If we do have price drops emerging, the inflation turning point is likely to be more pronounced.
There is one way in which our datasets can help identify these fast turning points situation: by looking at the News Volume Index (NVI).
The NVI measures inflation news total volume, also in the last 30 days. The inflation news sign may be positive, negative or undetermined by the models: the news will be counted as long as our NLP models identify items potentially relevant to the near-term inflation outlook.
So, when the NIPI (diffusion index) drops, if the NVI (volume) drops too, then most likely only the first phenomenon is at play and positive news are dropping out of the sample. A "mild" turning point is taking place.
When the NIPI drops and the NVI stays stable or even increases, then we are most likely in a situation where negative news have emerged. The turning point will be quicker and more pronounced.
Let's look at a recent example, US core inflation in the summer 2022:
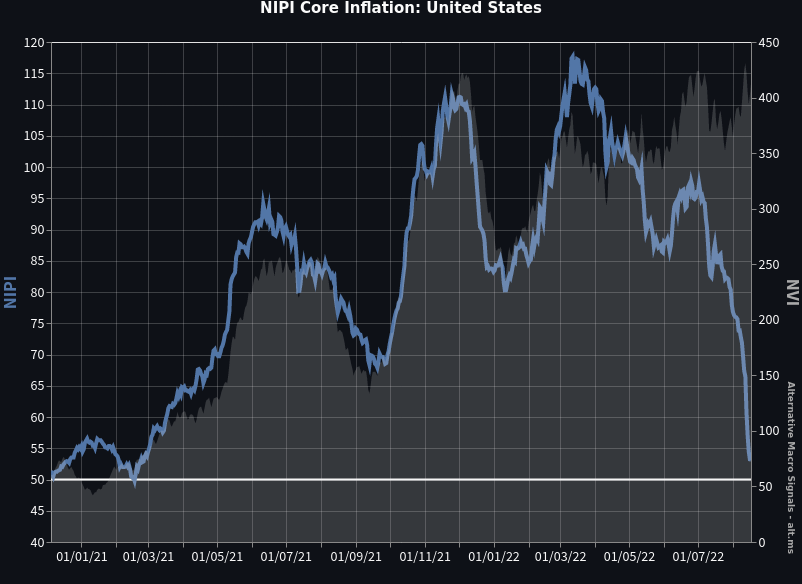
The US Core Inflation NIPI (the blue line, left-hand scale) has been dropping markedly since early July 2022. Remarkably, the NVI (the grey bars, right-hand scale) has remained elevated in the meantime, if anything rising slightly to near all-time highs.
Negative core inflation news have therefore emerged and have been partially offsetting a diminishing volume of positive news.
That calls for a quick core inflation turning point which, indeed, has started to materialise in the July CPI reading (see also Can the NIPI Identify Inflation Downturns as Well as It Has Signalled Upturns? ).
Read more:
Inquiries: reach out
