A look at our news-based inflation diffusion index in the euro area which has still some way to go to normalize

The NIPI is our daily diffusion index measuring inflation pressures through news articles. Back in 2021, it was instrumental in identifying the inflation upsurge in the euro area, well ahead of consensus.
Year-on-year inflation rates, while commonly used, are backward-looking in nature, hence the daily NIPI can prove critical to assess the near-term inflation momentum in the euro area.
What does the NIPI have to say now that inflation has been easing in most places? Does it support the view that inflation has been normalizing in the euro area, too?
The short answer is: the euro-area NIPI clearly came down from peak, but it is solidly above pre-COVID levels.
Our data show that price pressures exhibit some degree of persistence at this point and are not yet convincingly suggesting a durable return to 2% inflation in the euro area.
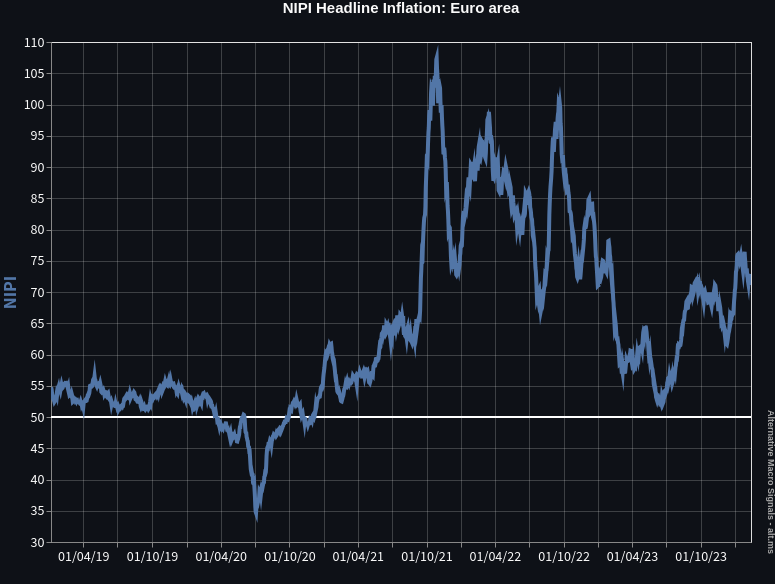
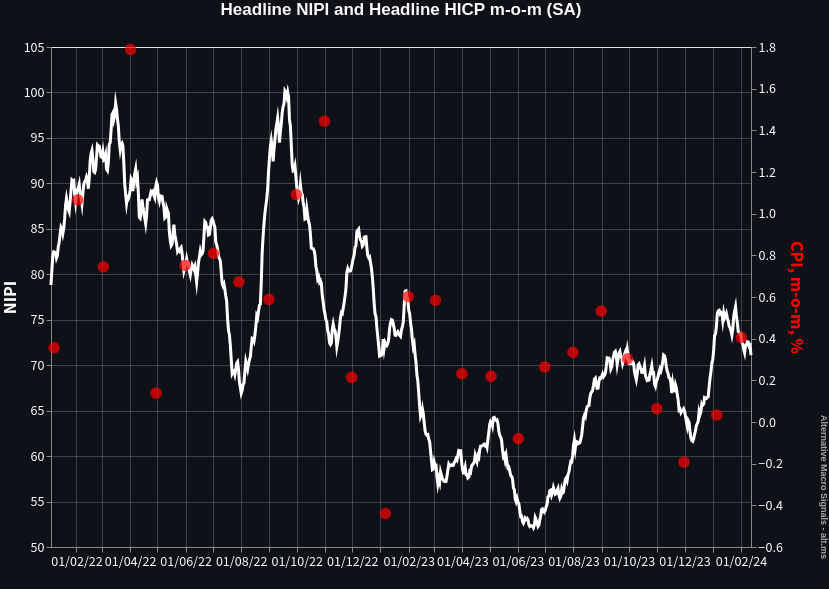
Note: Data shown as of release date. HICP m-o-m calculated from ECB SA series. A NIPI value of 50 indicates a balanced volume of inflation-positive and negative news articles.
The second chart illustrates that the inflation trend is still consistent with HICP m-o-m inflation rates around 0.3%, i.e. above 3% annualized.
