Our news-based inflation measures can help overcome the trickiness of inflation momentum analysis in the euro area. This blog post gives our take on their recent readings.
Mid-September, our news-based measure of inflation trends started flashing red in the euro area ( "Is Euro Area Inflation at a Breakpoint?", 23 Sept. 2021).
Here's a quick look back, and ahead, following the November Flash HICP release:
No "base effects" here
One problem in the eurozone is to agree on the inflation variable of interest to analyze the short-term momentum.
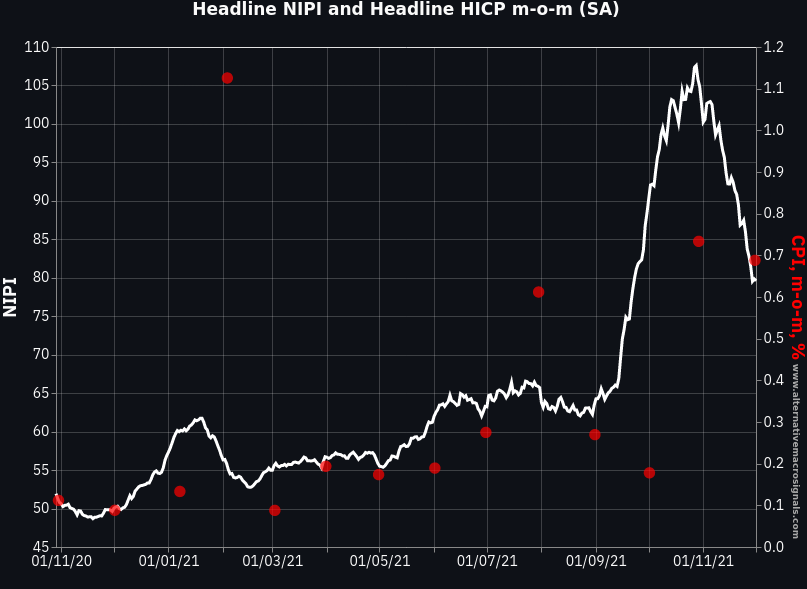
The HICP data shown above is month-on-month rates of changes seasonally adjusted by the ECB - reported as of first release date. That's our take on realised short-term inflation momentum.
Seasonal adjustment can be tricky in the eurozone. But if the goal is to analyze short-term dynamics, at least trying to look at SA month-on-month rates is a far better approach than sticking with year-on-year rates and getting "lost in base effects" (i.e. month-on-month changes that happened 12 months ago).
Besides, it makes no sense to compare today's data (the NIPI or the PMI output prices, for instance) with inflation over the previous twelve months...
There are alternative approaches to looking at seasonally adjusted HICP data, but the ECB data are certainly a useful starting point.
Lower, but still high
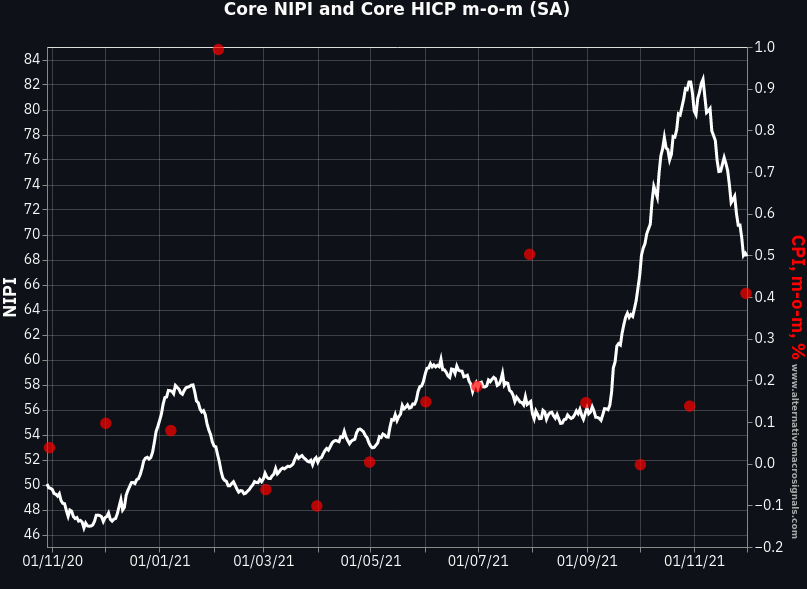
Back to the data, the NIPIs have suggested an uptrend in both core and non-core inflation pressures in recent months and the last couple of HICP observations came in line. That's just very similar to the US (see "The NIPI as a predictor of US inflation: Nov-2021 update" , 10 Nov. 2021.)
Looking ahead, the NIPIs have eased from the highs recently in the euro area, which would be consistent with softer month-on-month rates than the dramatic jumps in November.
The main reason for the easing is a reduced volume in news relating with energy prices (non-core) and their expected indirect effects on other goods and services (which impacted core in the up phase). To be fair, easing food pressures are also contributing (unlike the US).
However, bear in mind that:
1/ the levels remain elevated.. the core NIPI is just suggesting trend core inflation should be closer to 0.2-0.3% m-o-m than 0.3-0.4%.. that's still well above 2% annualized, for core inflation!
2/ we suspect the NIPI lead over HICP could be longer than usual because many gas and electricity price hikes stories in the news have yet to come into force between December and February 2022.
3/ Earlier this year, the US NIPI went through a similar path: easing from the highs at the end of the summer, before rebounding to even higher levels in recent weeks (both core and headline).
To sum up, our NIPIs suggest that the short-term inflation momentum is now lower than in October-November (looked at in m-o-m rates), but could still exceed the 2% inflation goal. Pipeline price pressures remain elevated.
Notes
The News Inflation Pressure Index (NIPI) measures the directionality of the news flow. When the NIPI is at 50, positive and negative news balance each other. When the index rises above 50, the news flow signals positive inflation pressures are building up, and vice versa when the index drops below 50.
The data is available daily for the following countries: US, UK, Euro area, Germany, France, Italy, Spain, Canada, Australia, India, South Africa, Mexico and Argentina.
And the following sectors: headline inflation, core inflation, energy, food, telecom services and wages.
The NIPIs are based on state of the art Natural Language Processing applied to hundreds of thousands of news sources in six languages (Chinese, English, French, German, Italian and Spanish).
The Inflation NewsBot provides a daily selection of news relevant to the near-term inflation forecast which then enter in the NIPI calculation.
For any inquiries, including trial request, you can use our contact form.
