We introduce a Supply Chain Inflation measure derived from NLP analysis of news articles. It highlights key distinctions between tariff and COVID-19 shocks and offers insights to monitor the spread of supply chain disruptions looking forward.
The COVID-19 pandemic exposed significant gaps in economists' statistical toolkit, like keeping track of empty shelves in supermarkets.
As we are facing another turmoil, a critical question emerges: Are we better prepared to monitor potential disruptions caused by trade tariffs in global supply chains? How can we assess these disruptions' economic impact, particularly on households, and understand their potential inflation implications?
Our research leverages historical news analysis using language models to address these challenges, introducing novel metrics for tracking economic pressures.
The Toolbox
First, a brief reminder about the News Balance and the News Volume - readers already familiar with our data can jump to the next section - and how they fit in our toolbox to analyse inflation news.
Our starting point was to train several Language Models to analyse news articles and identify those potentially relevant to the near-term inflation forecasts, using LLMs but before they became fashionable. We have used "supervised learning" (in this case, economists providing examples of what is relevant and what is not), as we found much better results than with out-of-the box large models (including the most recent ones). The models are stable and have not been revised since inception around 2020. In technical terms, the data below is truly "out-of-sample".
We have processed a large database of inflation news which were rated by the language models and identified as "relevant to the near-term inflation forecast".
From these, we have built various metrics - diffusion indices and volume measures - available out of the box, on a daily basis, for a range of countries (23 currently) and inflation components, with history going back to 2018.
The below chart shows the NIPI (News Inflationary Pressures Index), our main metric, for US Headline inflation.
Chart 1: Headline inflation news diffusion index (50=neutral)
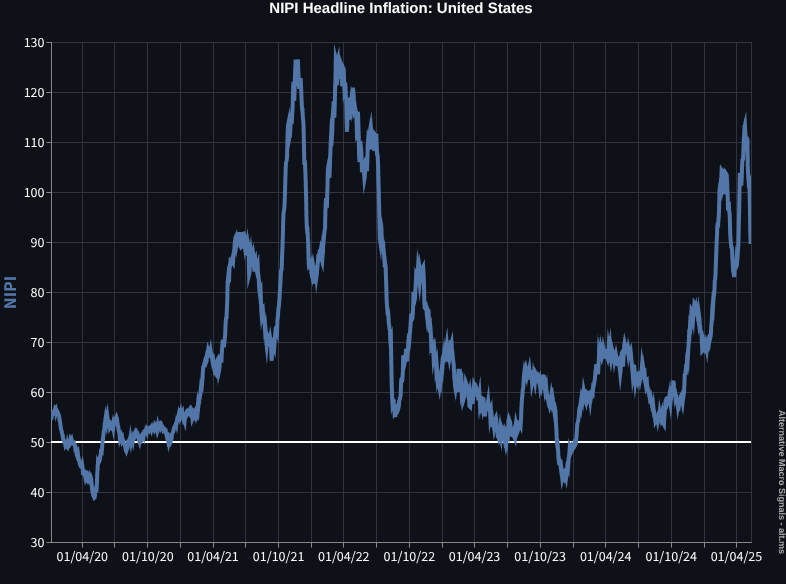
The NIPIs measure the balance of positive and negative inflation news. A score of 50 represents a neutral state, with equal volumes of positive and negative news.
They have proved invaluable for tracking inflation trends and inflation expectations.
However, aggregate measures have limitations. While they capture broad trends like supply disruptions, they don't precisely identify the shocks origin.
To address this, we created the "NewsBot app", allowing users to query specific terms and obtain detailed News Balance and News Volume metrics. This flexible approach enables real-time tracking of emerging economic themes (see also this article for a review of our different metrics).
Supply Chain Inflation
Using the "NewsBot app" News Volumes, we want to keep track of mentions of supply chain issues that would be relevant to consumer goods and services delivery. We need to do it across a range of countries, in order to gauge the extent to which they spread from the US to the rest of the world.
Last but not least, we want to be able to compare those disruptions with what they were during COVID.
We have built a supply chain stress indicator by analyzing news articles mentioning supply chain issues or consumer product shortages, among those news articles identified as potentially relevant to the near-term inflation forecast.
Chart 2 shows the number of those news articles in the US, averaged over 7 days period (the dotted line) or 30 days (the solid line):
Chart 2: Supply Chain Inflation (News Volume), United States
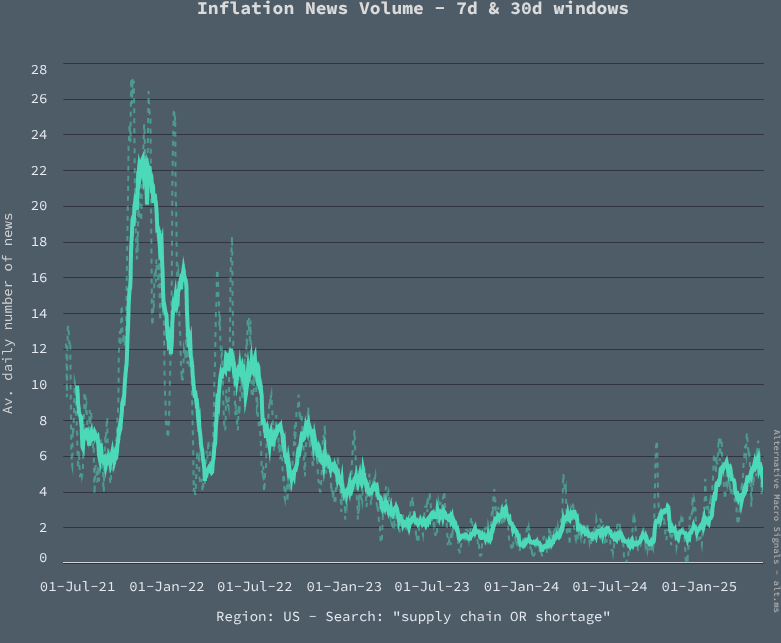
Supply chain inflation news has recently been 2 to 3 times higher than in 2023-2024, currently averaging around 5 news articles every day of the week, over the last couple of months or so.
Such levels are, however, significantly below COVID peak levels (approximately 23 articles per day in early 2022).
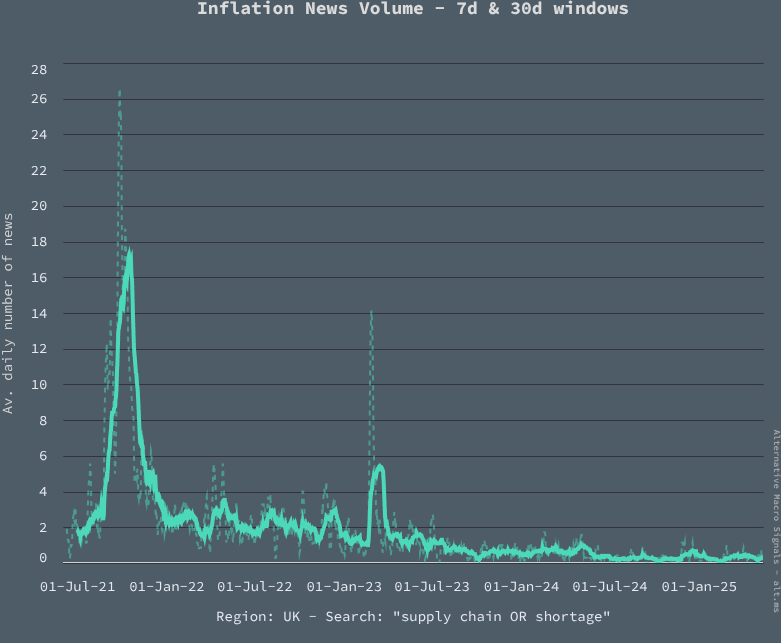
Turning to international comparisons, there are no such pressures building up in the euro area or the United Kingdom, relative to COVID peak levels:
Chart 3: Supply Chain Inflation (News Volume), Euro area
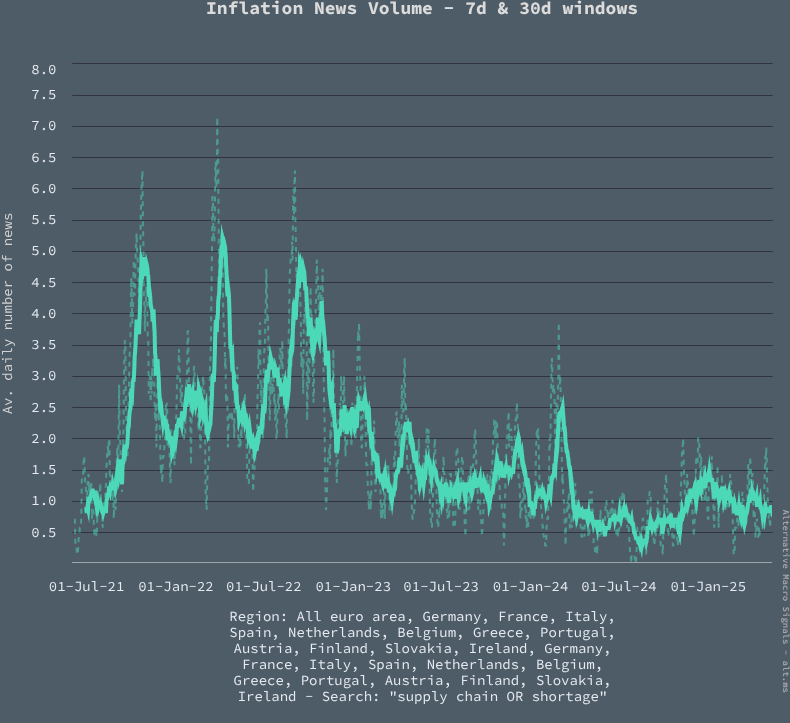
Chart 4: Supply Chain Inflation (News Volume), UK
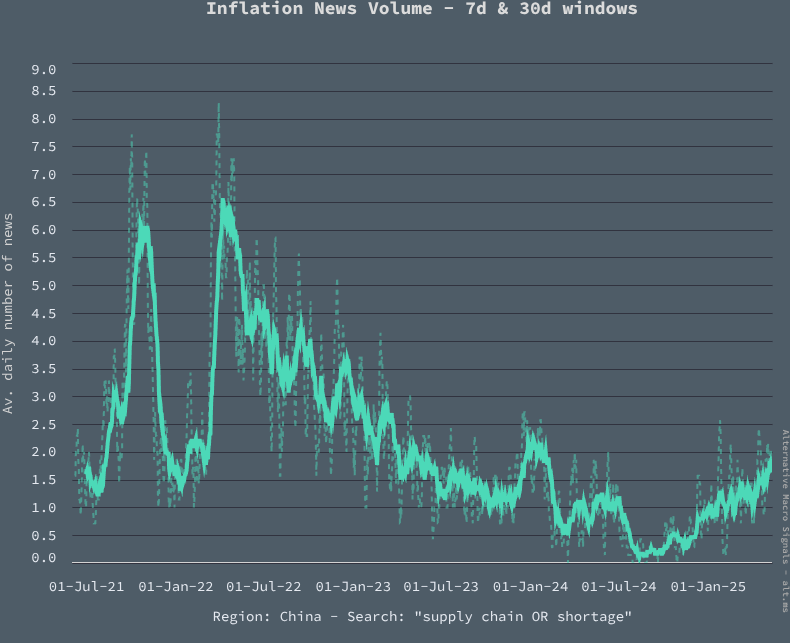
In China, too: Supply Chain Inflation pressures remain negligeable, or at least within the range of the last 2 1/2 years:
Chart 5: Supply Chain Inflation (News Volume), China
We could carry on with international comparisons, to find only minor deviations from the above observations.
It is worth highlighting that, during COVID, the supply chain shock really was global, and very much synchronized between regions, unlike what we have observed since the start of the year.
To sump up, the current situation differs from the COVID-19 supply chain breakdown in two critical ways:
- the supply shock is, for now, smaller than it was during COVID (from the point of view of consumer inflation);
- it remains generally limited to the US.
We certainly would not rule out some spreading of those US-specific supply tensions, but that is not a stage we are nearing, according to our data.
One pessimistic reading would be that things can get a lot worse... maybe. More likely, the two shocks - COVID-19 and trade war - are just very different and there simply is no historical template to match the current situation.
One key takeaway is to stick with a data-driven approach to analyse current economic conditions, with an open-mind about the potential transmission channels.
To know more about our data,reach out.
